
Pre-Ph.D. exam score of 10 students are plotted against their M.Sc. marks. Which of the following is true?
To solve this question, we need to analyze the given graph which shows the relationship between Pre-Ph.D. exam scores and M.Sc. marks for 10 students. Let's review the options and decide which statement is true based on the graph:
- Two students have scored better in Pre-Ph.D. than their M.Sc. exam.
- All those students who scored 50% in Pre-Ph.D. scored more percentage of marks in their M.Sc. exam.
- Two students scored the same percentage of marks in their Pre-Ph.D. and M.Sc. exams.
- The student who scored maximum in M.Sc. is the only student to get maximum in Pre-Ph.D. exam.
Analyze the graph:
- Option 1: Two students have points above the diagonal line (y = x), indicating they scored better in Pre-Ph.D. than in M.Sc. However, the graph does not support this as most points are below or on the line.
- Option 2: This statement is incorrect because not all students scoring 50% in Pre-Ph.D. scored higher in M.Sc.
- Option 3: On the graph, there are two points lying on the line where x = y, indicating two students have the same percentage in both exams.
- Option 4: The highest M.Sc. score does not necessarily correspond to the highest score in Pre-Ph.D.
Hence, the correct answer is Option 3: Two students scored the same percentage of marks in their Pre-Ph.D. and M.Sc. exams.
Important Questions from Data Interpetation (Notes)
The population of a town over the years 2000-2007 is shown in the given figure.
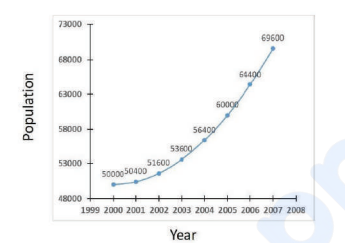
It can be inferred that during 2000-2007,
The areas (in km²) under forests in four countries A, B, C and D for the years 2014 and 2024 are shown in the given bar chart:
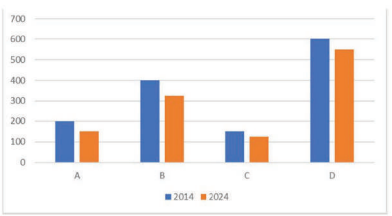
The minimum percentage of deforestation during 2014-2024 was in country- Find the average amount collected from the sales of Bengali dishes, Punjabi dishes and Gujarati dishes.
- The amount collected by selling Chinese dishes is approximately what percentage more than the amount collected by selling Bengali dishes?
- The number of questions asked in shift I from the topic Profit-Loss is what percent more than the number of questions asked in shift II from the topic Average?


