The following table shows the number of shoes sold by five different salesmen (A-E) on seven different days (Monday to Sunday) in a given week. Based on the data in the table, answer the questions that follow.Salesman Number of Shoes Sold Monday Tuesday Wednesday Thursday Friday Saturday Sunday A 90 80 56 96 40 40 48 B 184 180 24 54 32 52 196 C 72 160 26 60 76 94 124 D 92 120 128 24 104 152 68 E 36 96 138 116 160 30 20
To solve the problem, let's first gather the necessary data from the table given for salesmen C and B:
- Salesman C's sales on Wednesday and Saturday:
- Wednesday: 26 shoes
- Saturday: 94 shoes
- Salesman B's sales on Monday and Sunday:
- Monday: 184 shoes
- Sunday: 196 shoes
- Next, we need to determine what percentage the number of shoes sold by C on Wednesday and Saturday together (120 shoes) is of the number of shoes sold by B on Monday and Sunday together (380 shoes). This can be calculated using the formula for percentage:
Percentage = \(\left( \frac{120}{380} \right) \times 100\)
- Calculating this gives:
Percentage = \(\left( \frac{120}{380} \right) \times 100 \approx 31.58\%\)
Therefore, the number of shoes sold by salesman C on Wednesday and Saturday together is approximately 31.58% of the number of shoes sold by B on Monday and Sunday together.
Correct Answer: 31.58%
Important Questions from Tabulation
- An object is placed beyond the centre of curvature (C) of a concave mirror. The image formed will be now:
Directions:
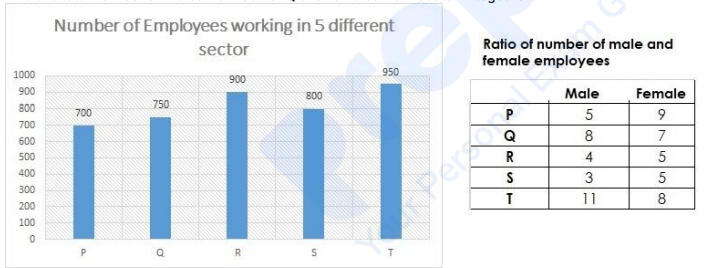
Using the data from the graph answer the question below:
Find the total number of males from sector P and females from sector R together.
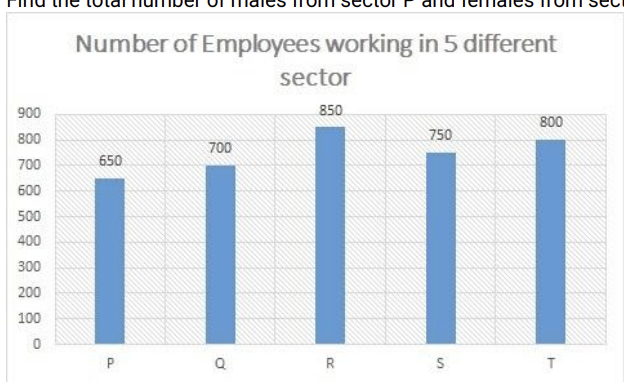
Ratio of number of male and female employees
Male Female P 6 7 Q 5 9 R 9 8 S 7 8 T 3 5 Directions:
Using the data from the graph answer the question below:
Number of Employees working in 5 different sector:
Find the number of males from sector Q.
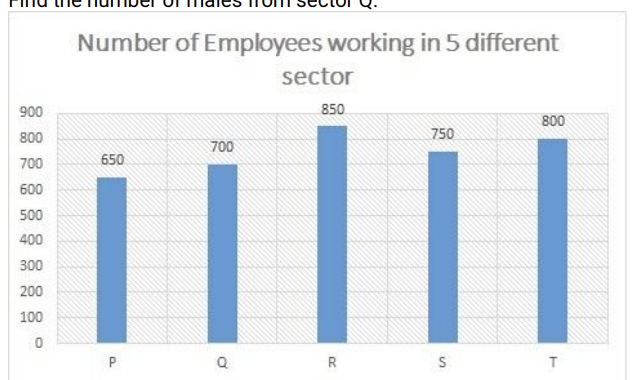
Ratio of number of male and female employees:
Male Female P 6 7 Q 5 9 R 9 8 S 7 8 T 3 5 Directions:
Using the data from the graph answer the question below:
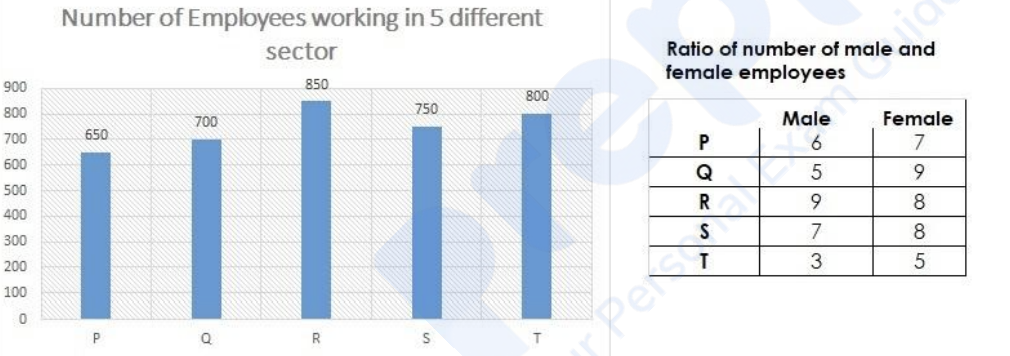
Find the ratio between number of males from the sector T to number of females from the sector S.
Directions:
Using the data from the graph answer the question below:
Find the total number of males from sector Q and females from sector P together.