Instructions: Study the graph below and answer the question based on it. The number of vehicles manufactured by the company X and Y, from 2001 to 2006, has been given (in thousands).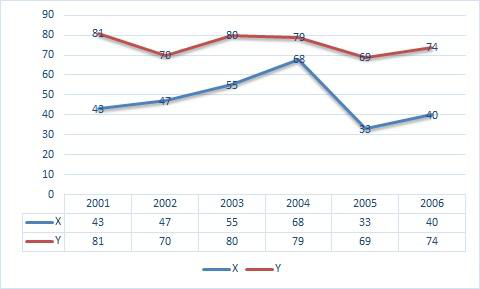
In which year was the difference between the production of Company X and Company Y the lowest?
2004
2004 is correct.
From the graph, the gap between Company Y and Company X each year (in thousands) is: 2001: 81 − 43 = 38; 2002: 70 − 47 = 23; 2003: 80 − 55 = 25; 2004: 79 − 68 = 11; 2005: 69 − 33 = 36; 2006: 74 − 40 = 34.
The smallest of these gaps is 11, in 2004.
Similar Questions
What is the difference between the number of vehicles produced by Company X in the year 2001 and 2002?
Find out the difference between the total production of both companies in the given years.
Important Questions from Bar Graph and Line Graph
The table given below shows the cost price and value of profit of 6 articles.
Articles Cost price Profit D 700 200 E 600 150 F 400 300 G 500 400 H 300 250 I 800 350 Which of the following statement is NOT correct?
I. The profit of D, E and F is 30.63 percent of the cost price of G, H and I.
II. The ratio of total cost price to the total profit is 1 ∶ 2.
A ________ is often drawn as a guide, so that a frequency polygon can be drawn over the top.
The table given below shows the cost price and selling price of 5 different articles.
Article Cost price Selling price A 500 600 B 700 750 C 600 800 D 400 700 E 300 800 What is the ratio of total cost price to total selling price of all articles?
The bar chart given below shows the number of boys and girls in 5 schools.
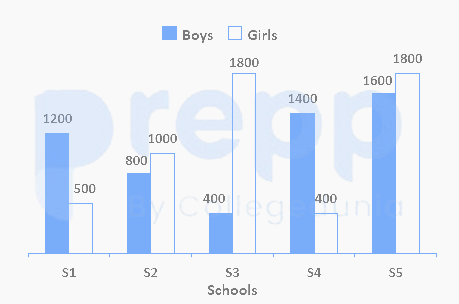
If the number of boys in school S6 are 30 percent more than the number of girls in school S1, then number of girls in schools S3 and S4 is what percentage of number of boys in schools S6 and S1 ? (correct to two decimal places)
The given histogram shows the heights of 232 students of an athletic club and their numbers.
Study the histogram carefully and answer the questions that follows.
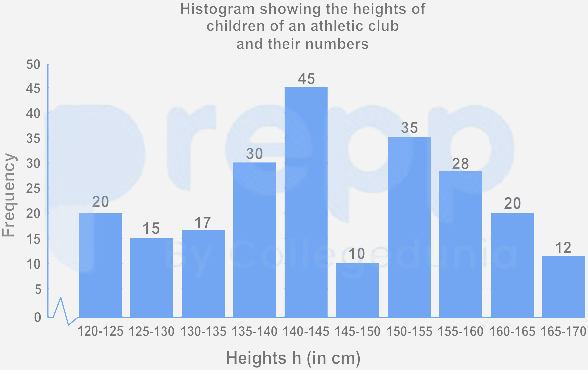
If the histogram is to be presented by a line diagram, what would be the starting point and the end point of the line diagram?