Directions:
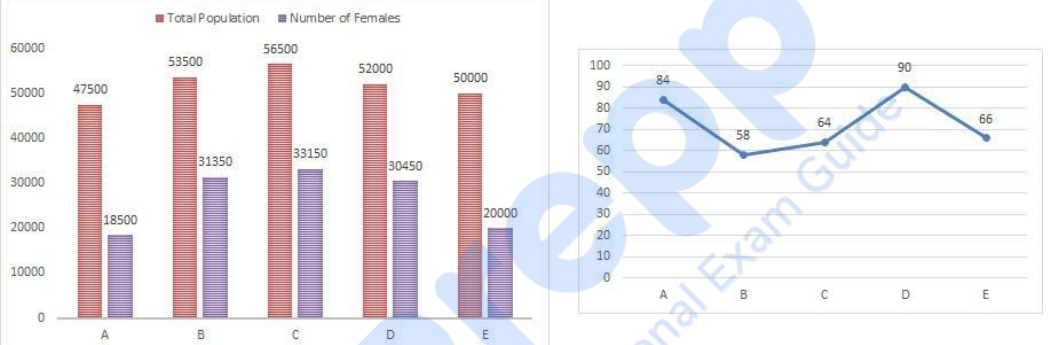
These data are based on the bar graph and line graph.
The following bar graph gives the the total population of five cities(A, B, C, D and E) and number of females in the cities.
The following line graph gives the percentage of literates among females for each cities.
Find the number of females who is illiterate from city C.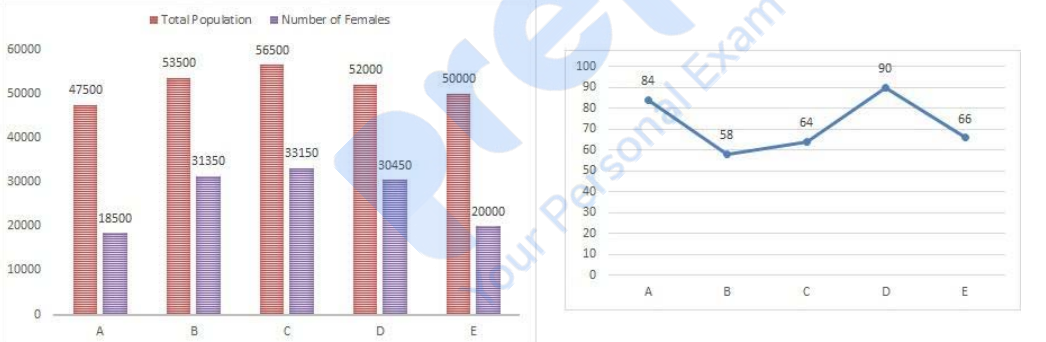
To find the number of illiterate females in city C, follow these steps:
- From the bar graph, note the number of females in city C is 33,150.
- From the line graph, the percentage of literate females in city C is 64%.
- Calculate the number of literate females in city C:
\(\text{Literate Females} = \frac{64}{100} \times 33150 = 21216\text{ females}\) - Calculate the number of illiterate females by subtracting the literate females from the total number of females:
\(\text{Illiterate Females} = 33150 - 21216 = 11934\text{ females}\)
Therefore, the number of illiterate females in city C is 11,934.
Important Questions from Bar Graph and Line Graph
The table given below shows the cost price and selling price of 5 different articles.
Article Cost price Selling price A 500 600 B 700 750 C 600 800 D 400 700 E 300 800 What is the ratio of total cost price to total selling price of all articles?
The table given below shows the cost price and value of profit of 6 articles.
Articles Cost price Profit D 700 200 E 600 150 F 400 300 G 500 400 H 300 250 I 800 350 Which of the following statement is NOT correct?
I. The profit of D, E and F is 30.63 percent of the cost price of G, H and I.
II. The ratio of total cost price to the total profit is 1 ∶ 2.
A ________ is often drawn as a guide, so that a frequency polygon can be drawn over the top.
Directions:
These data are based on the bar graph and line graph.
The following bar graph gives the total population of five cities(A, B, C, D and E) and number of females in the cities.
The following line graph gives the percentage of literates among females for each cities
Find the number of males in city B.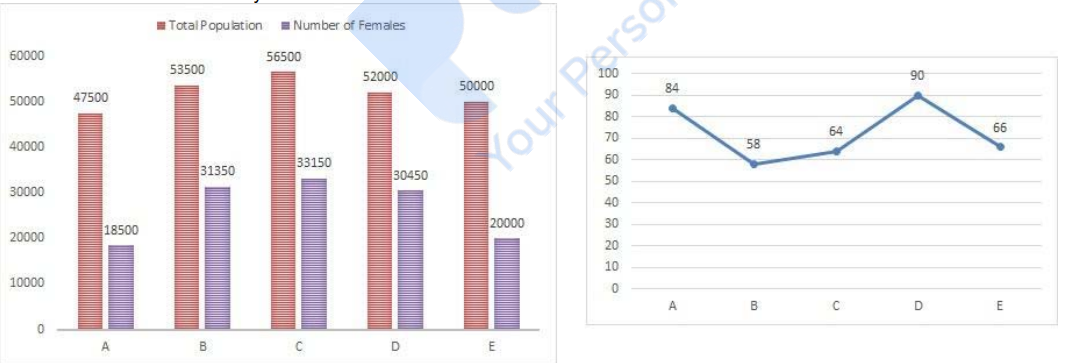
Directions:
These data are based on the bar graph and line graph.
The following bar graph gives the total population of five cities(A, B, C, D and E) and number of females in the cities.
The following line graph gives the percentage of literates among females for each cities.
Find the number of females who are literate from city A.