Direction: The following line graph gives the ratio of the amounts of imports by a company to the amount of exports from that company over the period from 1995 to 2001.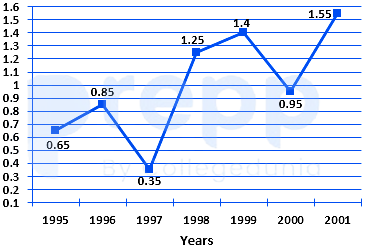
In which year, the import were minimum proportionate to the export of the company?
1997
The minimum ratio of the import to export of the company in the given years = 0.35
∴ The imports were minimum proportionate to the export of company in 1997Important Questions from Line Graph
What is the difference between the total production of Ford and Tata motors in the given years?
What is the average number of cars manufactured by Honda over the given period?
The production of Honda in 2018 was approximately what percent of the production of Tata Motors in the same year?
What is the difference between the number of cars manufactured by Ford in the year 2018 and 2019?
What is the average of all the cars manufactured by Tata Motors and Honda in 2016 and 2019?