
In the table the population of country A, B and C is given. Which country has the minimum total of population of all the years together? Year Country A Country B Country C 2014 5000 8000 11000 2015 10000 8000 14000 2016 11000 9000 13000 2017 12000 9000 16000 2018 9000 11000 14000
B
Analyzing Population Data to Find Minimum Total
The question provides population data for three countries, A, B, and C, over several years from 2014 to 2018. We need to determine which country has the minimum total population when summing the populations across all these years.
First, let's look at the given data in a structured format:
| Year | Country A Population | Country B Population | Country C Population |
|---|---|---|---|
| 2014 | 5000 | 8000 | 11000 |
| 2015 | 10000 | 8000 | 14000 |
| 2016 | 11000 | 9000 | 13000 |
| 2017 | 12000 | 9000 | 16000 |
| 2018 | 9000 | 11000 | 14000 |
Calculating Total Population for Each Country
To find the country with the minimum total population, we need to calculate the sum of the populations for each country over the five years (2014-2018). We will sum the values in each country's column.
- Total Population for Country A:
We add the population of Country A for each year:
$\text{Total Population}_\text{A} = 5000 + 10000 + 11000 + 12000 + 9000$
$\text{Total Population}_\text{A} = 47000$
- Total Population for Country B:
We add the population of Country B for each year:
$\text{Total Population}_\text{B} = 8000 + 8000 + 9000 + 9000 + 11000$
$\text{Total Population}_\text{B} = 45000$
- Total Population for Country C:
We add the population of Country C for each year:
$\text{Total Population}_\text{C} = 11000 + 14000 + 13000 + 16000 + 14000$
$\text{Total Population}_\text{C} = 68000$
Comparing Total Populations
Now that we have calculated the total population for each country over the given years, we compare these totals to find the minimum:
- Country A Total Population: 47000
- Country B Total Population: 45000
- Country C Total Population: 68000
Comparing these three values (47000, 45000, and 68000), we can clearly see that 45000 is the smallest value.
Conclusion: Minimum Total Population
The minimum total population among the three countries over the years 2014-2018 is 45000, which corresponds to Country B.
Therefore, Country B has the minimum total of population of all the years together.
Revision Table: Key Population Concepts
| Concept | Description | Relevance to Problem |
|---|---|---|
| Population Data | Numerical information about the number of individuals in a specific area. | The core data provided for countries A, B, and C over several years. |
| Total Population | The sum of the population figures over a specified period or area. | What we calculated for each country by summing populations across years. |
| Minimum Value | The smallest number in a set of numbers. | Finding the lowest total population among the three countries. |
| Data Analysis | The process of inspecting, cleaning, transforming, and modeling data to discover useful information. | The overall method used to solve the problem by calculating and comparing totals. |
Additional Information: Analyzing Data Tables
Analyzing data presented in tables is a fundamental skill in many fields. When working with tables, you often need to:
- Understand the headers (columns and rows) to know what the data represents.
- Extract relevant data points.
- Perform calculations (like sum, average, difference) on rows or columns.
- Compare values to identify trends, maximums, minimums, etc.
- Organize or summarize the data for better understanding.
In this problem, we focused on summing columns (total for each country) and then comparing these sums. Other problems might require summing rows (total population across countries for a specific year) or finding averages or differences.
Important Questions from Bar Graph and Pie Chart
The following tables show the product sold by a shopping app in 3 years. Find the average number of clothes sold by the app in all three years.
Products
2019
2020
2021
Cloth
824
476
500
Electronics
750
820
450
Makeup
660
810
510
Footwear
470
390
790
The table given below shows the number of male and female in different states.
States Male Female A 50 100 B 200 150 C 300 25 D 25 50 E 125 75 F 150 250 J1 = The value of average number of males in A and B.
J2 = The value of average number of females in E and F.
What is the value of (J2 - J1)?
A graph that displays data that changes Continuously over periods of time is-
Sales of books from four shops (B1, B2, B3, B4) in thousands are given as below. Study the graph and answer the following questions
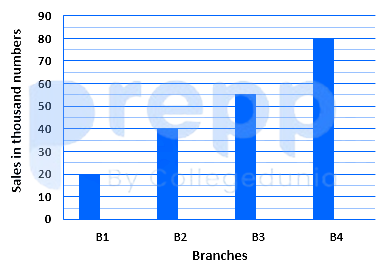
The number of shop in which sales of books are below the average level is:
- Sales of books from four shops (B1, B2, B3, B4) in thousands are given as below. Study the graph and answer the following questions.
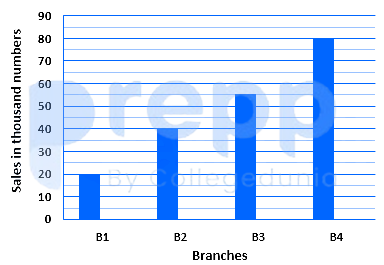
The average sales of book from shop B1, B2 and B4 is closest to:


