
In the given diagram, ovals are marked at different heights ($h$) of a hill. Which one of the following options P, Q, R, and S depicts the top view of the hill?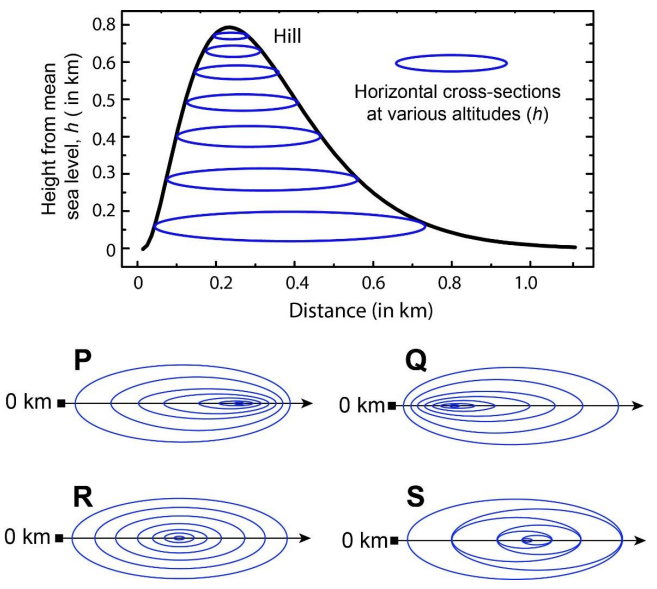
To solve this question, we need to identify the top view of a hill based on the given horizontal cross-sections. The diagram shows these cross-sections at various altitudes, indicating the shape of the hill as seen from above.
The concept here involves understanding contour lines or contour mapping, where each line represents a constant height. The closer these lines are to each other, the steeper the hill is at that point.
From the given diagram:
- As height increases, the ovals get smaller, which implies a slope that tapers off as it reaches the top.
- The most probable top view will have the smallest oval near the center, surrounded by larger ovals as the height decreases going outward.
Upon examining the options:
- Option P: Ovals are becoming larger outward, but their density doesn't suggest a uniformly tapering hill.
- Option Q: Shows a clear center with the smallest oval surrounded by larger ovals, mimicking a gradual elevation to a peak.
- Option R: Similar to P, does not suggest a consistent tapering towards a single peak point.
- Option S: Less consistent tapering pattern, does not resemble a top view of a single topped hill.
Thus, Option Q correctly depicts the top view of the hill.
Conclusion: The correct answer is Q as it best represents the gradual tapering and pointed top view of the hill as seen from above.
Important Questions from Maps
- A site in a map drawn to scale of 1:16000 measures 75 sqcm. The actual area of the site in hectares is
A contour line joins locations having the same height above the mean sea level. The following is a contour plot of a geographical region. Contour lines are shown at 25 m intervals in this plot.
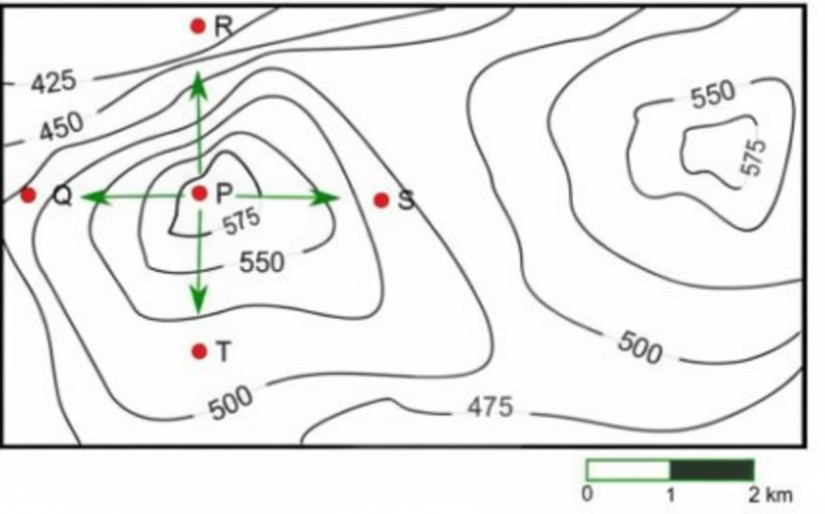
Which of the following is the steepest path leaving from P?


