
Forest patches are embedded within a landscape dominated by crop fields. The crop fields around fragmented forest patches are thought to affect the abundance of different butterfly species to different extents. The graph below shows the pattern of butterfly abundance (means, and error bars representing 95% confidence intervals) of three species, M, N, and O between the forest patches and the crop fields. Which one of the following options best describes the impact of fragmentation on the three different butterfly species?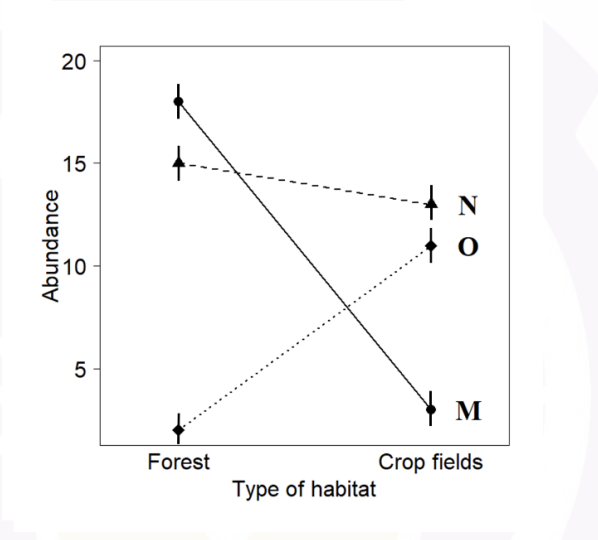
To determine the impact of fragmentation on the three butterfly species (M, N, and O), we will analyze the provided graph.
The graph shows the abundance of the butterfly species in two habitats: Forest and Crop fields. Let's interpret the changes observed in the abundance of each species:
- Species M:
- The abundance of species M decreases significantly when moving from forest patches to crop fields. This indicates a strongly negative impact of fragmentation on species M.
- Species N:
- The abundance of species N decreases slightly when moving from forest patches to crop fields. This suggests a weakly negative impact on species N.
- Species O:
- The abundance of species O increases significantly when moving from forest patches to crop fields. This indicates a strongly positive impact of fragmentation on species O.
Considering the above interpretations, the option that best describes the impact of fragmentation on the three butterfly species is: M – strongly negative; N – weakly negative; O – strongly positive.
Important Questions from Community structure
- Match the mollusc taxa to their respective orders.
Mollusc taxa Order I Cone snails P Bivalve II Octopuses Q Gastropod III Giant clams R Cephalopod IV Squids - Local communities are comprised of a subset of species from the regional species pool. Which one of the following processes is LEAST likely to cause species composition of local communities to differ from one another?


