The questions that follow are based on the following information. Following is the table about the land under cultivation of different crops. We have to draw a Pie diagram to represent the information in the table.Crop Angle of the sector (in degrees) Sugarcane 108 Wheat 63 Rice 72 Vegetables 27 Fruits x
Find the percentage of land under the crop sugarcane.
30%
In a pie diagram the angle of a sector is proportional to the share of that item in the total, with the full circle of 360° standing for 100%. Therefore the percentage for any crop equals its sector angle divided by 360°, multiplied by 100.
Percentage of land under sugarcane = \((\frac{108^{\circ}}{360^{\circ}}) \times 100\)
\(= 0.3 \times 100\)
\(= 30\%\)
Thus sugarcane occupies 30% of the cultivated land. A share of 40% would need an angle of 144°, 55% would need 198°, and 65% would need 234°, none of which matches the 108° sector given in the table.
Hence, 30%.
Similar Questions
Find the percentage of expenses on sector ‘Food’ :
Find the angle in degrees associated with sector ‘other’.
Find the angle in degrees associated with the sector represented by crop ‘Fruits’.
Important Questions from Pie Chart
Study the following pie-charts carefully to answer the questions.
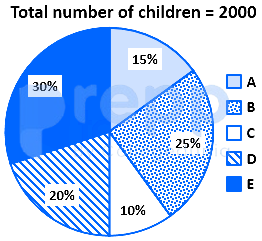
If 70 percent children from village D go to school then what is the number of children attending school from village D ?
Study the following pie-charts carefully to answer the questions.Percentage break-up of number of children in five different villages
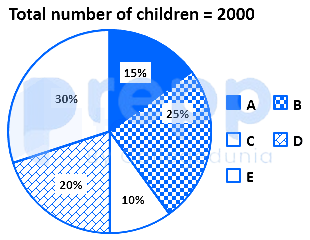
What is the respective ratio of total number of children from village A to village C ?
Study the following pie-charts carefully to answer the questions.Percentage break-up of number of children in five different villages
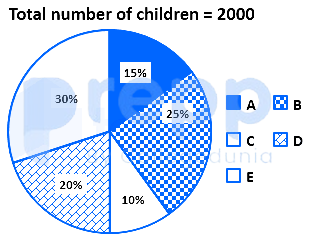
What is the total number of children in villages B and E ?
Study the chart and answer the question based, on the pie chart.The pie chart is given below shows expenditures incurred by a family on various items and savings in a month. Savings of the family is ₹ 8,000 in a month.
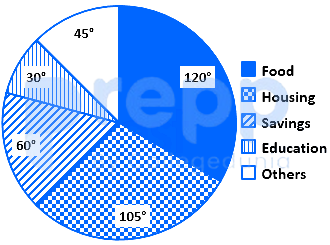
What is the total expenditure of the family for the month?
Study the chart and answer the question based, on the pie chart.The pie chart given below shows expenditures incurred by a family on various items and savings in a month. Savings of the family is ₹ 8,000 in a month.
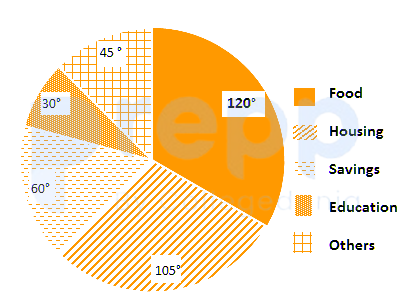
How much more amount is spent on food than on housing?