
Segment Total Voters % of voting X Y Z A 2,00,000 60 30 30 40 B 2,50,000 70 40 30 30 C 3,00,000 80 30 40 30
Calculating Election Votes Per Party
To determine the winning party, we need to calculate the total votes received by each party (X, Y, and Z) across all segments (A, B, and C).
Step 1: Calculate Votes Cast in Each Segment
- Segment A: Total Voters = 2,00,000; Voting % = 60% Votes Cast = $2,00,000 \times \frac{60}{100} = 1,20,000$
- Segment B: Total Voters = 2,50,000; Voting % = 70% Votes Cast = $2,50,000 \times \frac{70}{100} = 1,75,000$
- Segment C: Total Voters = 3,00,000; Voting % = 80% Votes Cast = $3,00,000 \times \frac{80}{100} = 2,40,000$
Step 2: Calculate Votes for Each Party in Each Segment
| Segment | Votes Cast | Party X Votes | Party Y Votes | Party Z Votes |
|---|---|---|---|---|
| A | 1,20,000 | $1,20,000 \times \frac{30}{100} = 36,000$ | $1,20,000 \times \frac{30}{100} = 36,000$ | $1,20,000 \times \frac{40}{100} = 48,000$ |
| B | 1,75,000 | $1,75,000 \times \frac{40}{100} = 70,000$ | $1,75,000 \times \frac{30}{100} = 52,500$ | $1,75,000 \times \frac{30}{100} = 52,500$ |
| C | 2,40,000 | $2,40,000 \times \frac{30}{100} = 72,000$ | $2,40,000 \times \frac{40}{100} = 96,000$ | $2,40,000 \times \frac{30}{100} = 72,000$ |
Step 3: Calculate Total Votes for Each Party
- Party X Total Votes: $36,000 + 70,000 + 72,000 = 1,78,000$
- Party Y Total Votes: $36,000 + 52,500 + 96,000 = 1,84,500$
- Party Z Total Votes: $48,000 + 52,500 + 72,000 = 1,72,500$
Step 4: Determine the Winner
Comparing the total votes:
- Party X: 1,78,000 votes
- Party Y: 1,84,500 votes
- Party Z: 1,72,500 votes
Party Y received the highest number of votes.
Important Questions from Data Interpetation (Notes)
The population of a town over the years 2000-2007 is shown in the given figure.
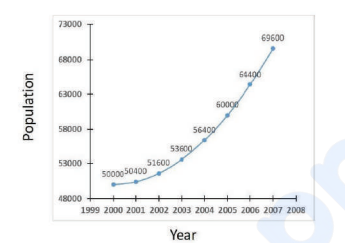
It can be inferred that during 2000-2007,
The areas (in km²) under forests in four countries A, B, C and D for the years 2014 and 2024 are shown in the given bar chart:
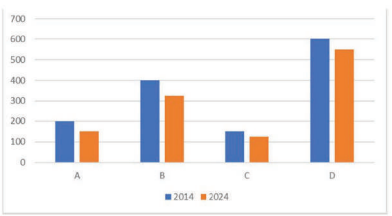
The minimum percentage of deforestation during 2014-2024 was in country- Find the average amount collected from the sales of Bengali dishes, Punjabi dishes and Gujarati dishes.
- The amount collected by selling Chinese dishes is approximately what percentage more than the amount collected by selling Bengali dishes?
- The number of questions asked in shift I from the topic Profit-Loss is what percent more than the number of questions asked in shift II from the topic Average?


