
Demographic Stochasticity Causes Random Population Growth
Demographic stochasticity refers to random variations in population characteristics resulting from chance events in the survival and reproduction of individuals.
Understanding the Correct Option:
- Option 2 correctly identifies that the "discrete nature of births and deaths" is the reason for random variation. Each birth or death is an individual event. The precise timing and occurrence of these events are subject to chance, especially when the population is small. This randomness in individual fates leads to unpredictable fluctuations in the overall population size and growth rate, introducing uncertainty in population parameters like the birth rate ($b$) and death rate ($d$).
Why Other Options Are Incorrect:
- Option 1 relates to environmental stochasticity, where random changes in the environment (like weather) affect population growth, not the inherent biological events of individuals.
- Option 3 describes density-dependence, a mechanism where population growth rate changes predictably with population density, contrasting with the random nature of stochasticity.
- Option 4 mentions predictable time lags, which relate to deterministic population dynamics or cycles, not random chance variations.
Important Questions from Population growth curves
- A flask containing nutrient-rich media is seeded with 100 isogenic bacteria. Assuming that no bacteria die in the flask, after approximately how many generations will the population reach a size of $10^5$?
Population growth of a species can be modelled as $$ \frac{dN(t)}{dt} = rN(t)\left(1 - \frac{N(t)}{K}\right) $$ where $N(t)$ is the population size at time $t$; $r$ is the growth rate; and $K$ is the carrying capacity of the environment.
For $K = 9000$, $\frac{dN(t)}{dt}$ is maximized at $N =$ _____
(Answer in integer)
- The population size at which net recruitment is the highest is also when the greatest amount can be harvested, while ensuring the long-term survival of the population. The amount harvested at this population size is known as
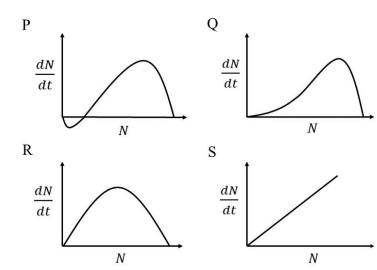
The graphs shown represent the relationship between population size ($N$) and population growth rate ($\frac{dN}{dt}$). Which one of the following growth curves represents a density-dependent population that experiences a strong Allee effect?
Overfishing reduced food availability for sea lions in California, causing a decline in their population size. In 1972, under the US Endangered Species Act, fishing was banned from sea lion foraging areas. Subsequently, the population of sea lions increased in a logistic form as shown in the figure.
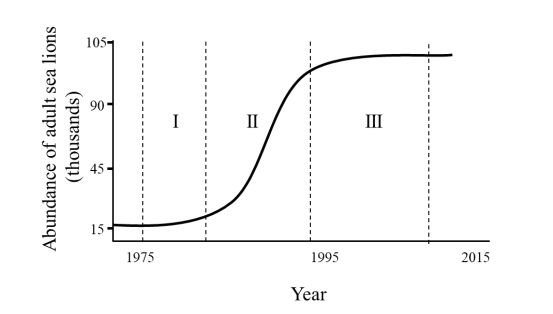
The per capita growth rate is highest in the interval __________ and the population growth rate is highest in the interval __________


