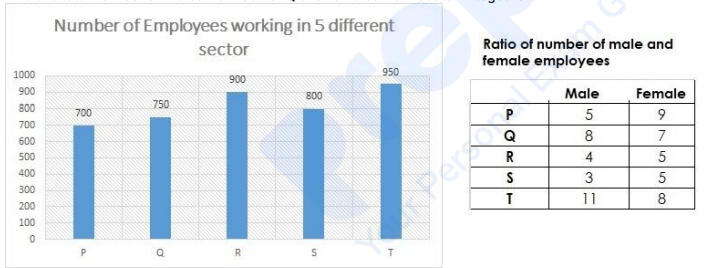
Consider the following table which contains number of corona test conducted in each hospital within bracket and number of positive cases in a city on a particular day. Based on the data in the table. answer question. Hospital Which hospital reported maximum number of positive cases?
→Hospital
A
(100)Hospital
B
(50)Hospital
C
(100)Hospital
D
(50)City ↓ City 1 30 15 35 10 City 2 35 10 30 10 City 3 15 5 15 5 City 4 10 5 5 15
Hospital A
Count:
The number of positive cases in Hospital A = 30 + 15 + 35 + 10 = 90
The number of positive cases in Hospital B = 35 + 10 + 30 + 10 = 85
The number of positive cases in Hospital C = 15 + 5 + 15 + 5 = 40
The number of positive cases in Hospital D = 10 + 5 + 5 + 15 = 35
Therefore, Hospital A reported the highest number of positive cases.
Important Questions from Tabulation
- An object is placed beyond the centre of curvature (C) of a concave mirror. The image formed will be now:
Directions:
Using the data from the graph answer the question below:
Find the total number of males from sector P and females from sector R together.
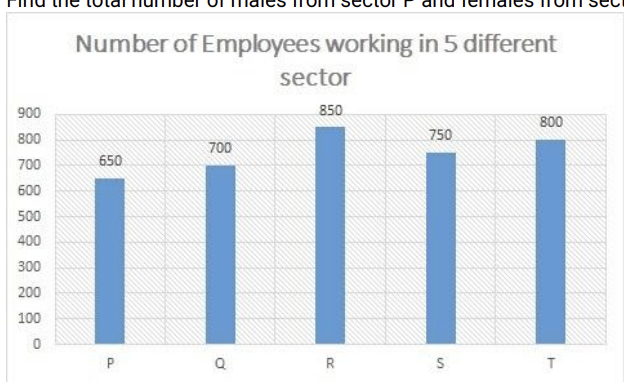
Ratio of number of male and female employees
Male Female P 6 7 Q 5 9 R 9 8 S 7 8 T 3 5 Directions:
Using the data from the graph answer the question below:
Number of Employees working in 5 different sector:
Find the number of males from sector Q.
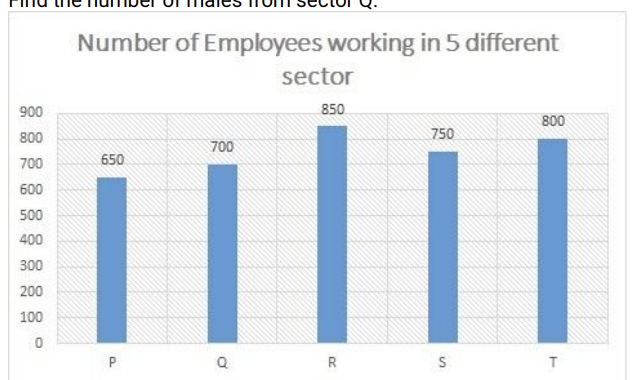
Ratio of number of male and female employees:
Male Female P 6 7 Q 5 9 R 9 8 S 7 8 T 3 5 Directions:
Using the data from the graph answer the question below:
Find the ratio between number of males from the sector T to number of females from the sector S.
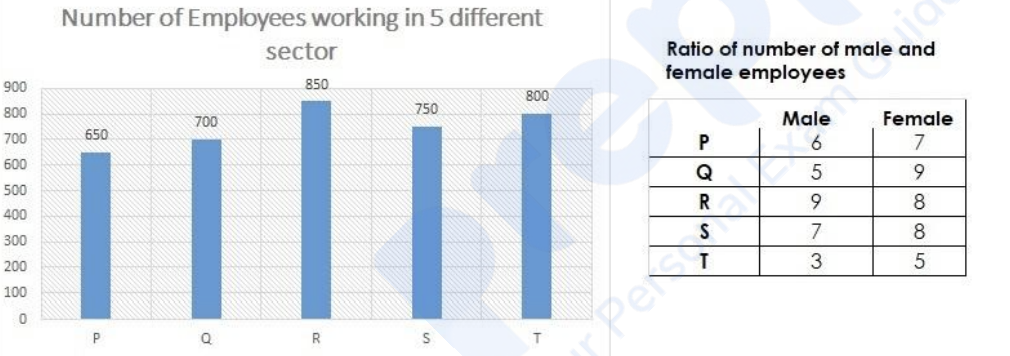
Directions:
Using the data from the graph answer the question below:
Find the total number of males from sector Q and females from sector P together.