
Consider the following frequency distribution of an ecological variable: Such a distribution with two peaks is called a bi-modal distribution. Here, the peak with the higher frequency is called the major mode and the one with the lower frequency is called the minor mode. A student has marked four points on the x-axis, i.e., P, Q, R and S. Match the points with the most appropriate statistic: Mean, Median, Major mode, and Minor mode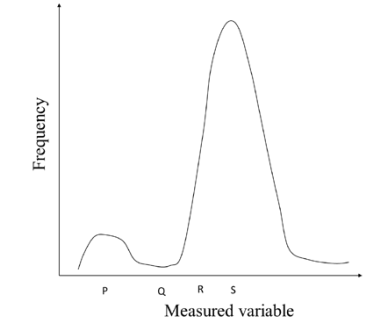
To solve the given problem, let's understand the concepts involved in a bimodal distribution:
- Mode: In a bimodal distribution, there are two peaks. The peak with the higher frequency is the major mode, and the peak with the lower frequency is the minor mode.
- Mean: The average of the dataset. It lies towards the side of the longer tail in a skewed distribution.
- Median: The middle value when data points are arranged in ascending order. It's less affected by extremes and usually lies between the mean and mode in asymmetrical distributions.
Now, we can analyze the points marked P, Q, R, and S on the x-axis:
- Point P is at the first peak of the distribution, where the frequency is lower. Hence, it represents the Minor Mode.
- Point R is around the center of the data distribution, indicating the balance point. Thus, it represents the Mean.
- Point S is at the highest peak, representing the point with the highest frequency. Therefore, it is the Major Mode.
Based on this analysis, we can match the points as follows: P-Minor mode, R-Mean, S-Major mode.
The correct option is: P-Minor mode, R-Mean, S-Major mode.
Important Questions from Mean Median Mode
- Five integers are picked from 0 to 20, with possible repetitions, such that their mean is 12, median is 18, and they have a single mode of 20.
Ignoring permutations, the number of ways to pick these five integers is _____ A data set is given to be $[1, 2, 0, -1, -3, 1, 2, 0, 1]$.
The median of the data set is ____. (rounded off to the nearest integer)
- The following sequence of numbers is arranged in increasing order: 1, x, x, x, y, y, 9,16,18. Given that the mean and median are equal, and are also equal to twice the mode, the value of y is
- The sample average of 50 data points is 40. The updated sample average after including a new data point taking the value of 142 is ________.
The mean absolute deviation about the median for the data 3, 9, 5, 3, 12, 10, 18, 4, 7, 19, 21 (rounded off to two decimal places) is ________________.


