Store-wise sale of LaptopsStore January February March April May A 430 376 440 346 408 B 312 506 336 380 366 C 370 556 470 324 460 D 428 360 530 356 306 E 420 382 384 484 500
Store A Laptop Sales Comparison: May vs. March
The question asks to find the approximate percentage that the number of Laptops sold by store A in May represents out of the number sold in March.
Identify Sales Figures
From the provided table:
- Laptops sold by Store A in March = 440
- Laptops sold by Store A in May = 408
Calculate Percentage
To find the percentage, use the formula:
$Percentage = (Part / Whole) * 100$
In this case:
$Percentage = (Sales in May / Sales in March) * 100$
Perform Calculation
Substitute the values:
$Percentage = (408 / 440) * 100$
Calculate the division:
$408 / 440 = 0.927272...$
Multiply by 100 to convert to percentage:
$0.927272... * 100 = 92.7272...%$
Approximate Result
Rounding the result to two decimal places gives 92.73%. This matches option C.
Important Questions from Tabulation
- An object is placed beyond the centre of curvature (C) of a concave mirror. The image formed will be now:
Directions:
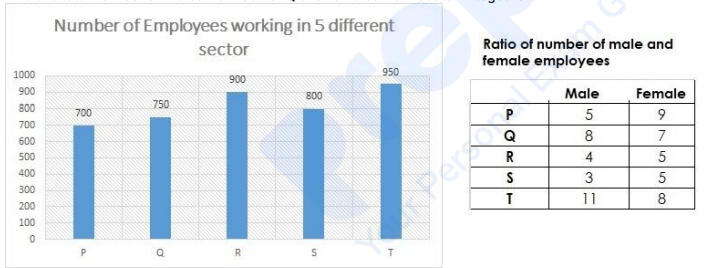
Using the data from the graph answer the question below:
Find the total number of males from sector P and females from sector R together.
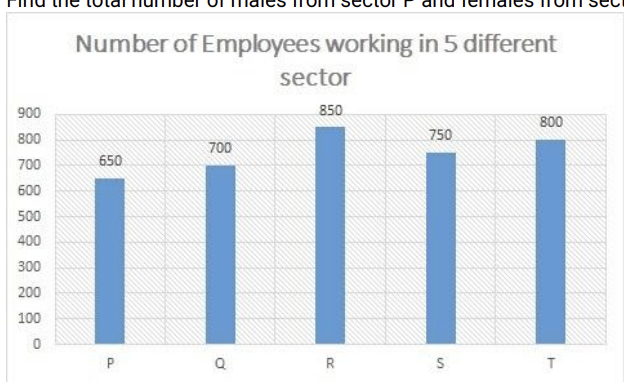
Ratio of number of male and female employees
Male Female P 6 7 Q 5 9 R 9 8 S 7 8 T 3 5 Directions:
Using the data from the graph answer the question below:
Number of Employees working in 5 different sector:
Find the number of males from sector Q.
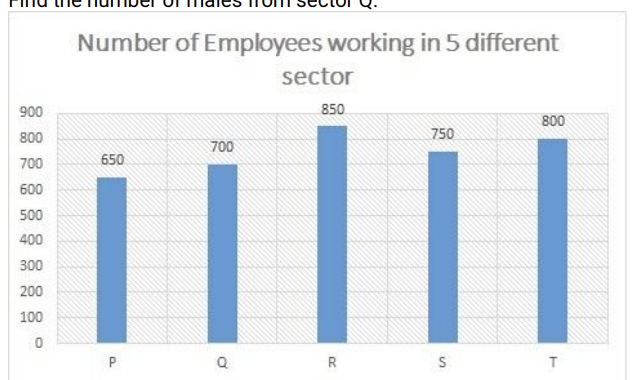
Ratio of number of male and female employees:
Male Female P 6 7 Q 5 9 R 9 8 S 7 8 T 3 5 Directions:
Using the data from the graph answer the question below:
Find the ratio between number of males from the sector T to number of females from the sector S.
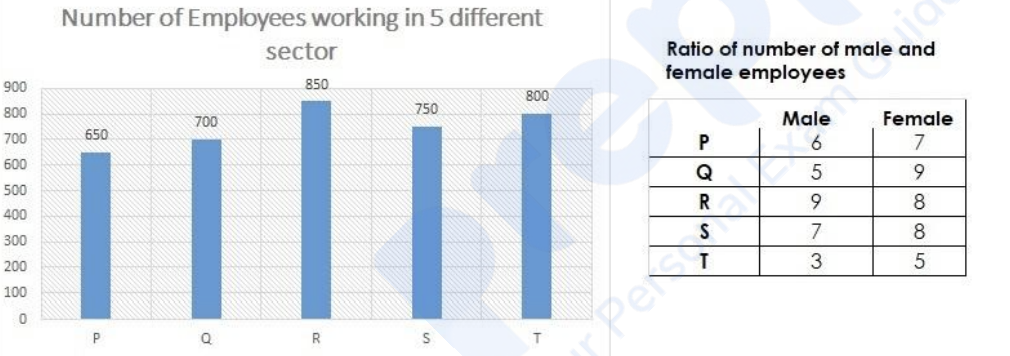
Directions:
Using the data from the graph answer the question below:
Find the total number of males from sector Q and females from sector P together.