
Question
Based on the distribution of surface area of the Earth at different elevations and depths (with reference to sea-level) shown in the figure, which of the following is FALSE?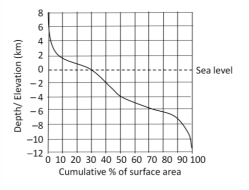
The correct answer is
Of the surface area below sea-level, smaller proportion lies below 4 km depth
To determine which statement is FALSE, let's analyze the graph and each statement.
- Statement 1: "Larger proportion of the surface of the Earth is below sea-level."
- The graph shows the cumulative percentage of the Earth's surface. More than 50% of the Earth's surface is below sea level. Therefore, this statement is TRUE.
- Statement 2: "Of the surface area above sea-level, larger proportion lies below 2 km elevation."
- The portion of the graph above sea-level (0 to 8 km) shows a steep increase until about 2 km, which indicates a large proportion of the above sea-level surface lies below this height. This statement is TRUE.
- Statement 3: "Of the surface area below sea-level, smaller proportion lies below 4 km depth."
- The section below sea-level (0 to -12 km) shows that after about 4 km depth, the curve is less steep, indicating that a significant proportion of the surface lies below 4 km. Hence, this statement is FALSE.
- Statement 4: "Distance from sea level to the maximum depth is greater than that to the maximum elevation."
- The maximum elevation is about 8 km, while the maximum depth is about 12 km. Therefore, the statement that maximum depth is greater than the maximum elevation is TRUE.
The FALSE statement is: "Of the surface area below sea-level, smaller proportion lies below 4 km depth."
Was this answer helpful?
Important Questions from Data Interpetation (Notes)
The population of a town over the years 2000-2007 is shown in the given figure.
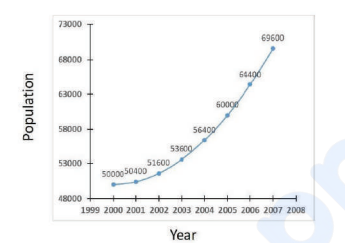
It can be inferred that during 2000-2007,
The areas (in km²) under forests in four countries A, B, C and D for the years 2014 and 2024 are shown in the given bar chart:
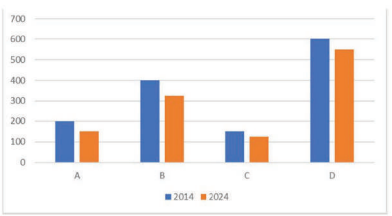
The minimum percentage of deforestation during 2014-2024 was in country- Find the average amount collected from the sales of Bengali dishes, Punjabi dishes and Gujarati dishes.
- The amount collected by selling Chinese dishes is approximately what percentage more than the amount collected by selling Bengali dishes?
- The number of questions asked in shift I from the topic Profit-Loss is what percent more than the number of questions asked in shift II from the topic Average?
Need Expert Advice?


