
A student wants to test the effect of latitude and longitude on seed size in a plant species. He has the resources to lay a maximum of 9 plots. Which plot design is most appropriate for this question?
Choosing Plot Design for Spatial Variables
The student aims to study how latitude and longitude affect seed size. These are spatial variables. The experiment is limited to a maximum of 9 plots.
Analyzing Plot Layouts
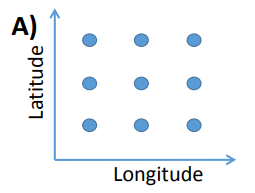
A suitable experimental design should allow for systematic observation of changes related to latitude and longitude. Among the given options, a grid layout is most appropriate for examining spatial gradients.
- A 3x3 grid uses exactly 9 plots.
- This grid structure naturally aligns with mapping spatial data. Rows can represent variations in latitude, and columns can represent variations in longitude.
- This allows the student to observe potential trends in seed size across different geographical coordinates within the experimental area.
Option A depicts a 3x3 grid, making it the most effective design for testing the influence of both latitude and longitude with the available 9 plots.
Important Questions from Sampling Theorems
In the construction of cost of living index, commodities are selected by:
If 4, 5, 6, 6, 6, 6, 6, 6, 6, 7 be a random sample from a Poisson population with parameter λ, then an unbiased estimate of λ is:
The data taken from the publication "sankhya" will be considered as:
A completely randomised design is based on the principles of ______ and randomisation only.
A sample of 30 latest returns on UTI stock reveals a mean return of $4 with a sample standard deviation of $0.13. The estimated standard error of the sample mean is:


