
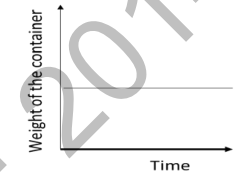
A student grows a bacterial culture in a container starting with a small population size and high resource levels. To estimate population growth, the student puts the container on a weighing machine after air-tight sealing of the container to avoid contamination. Which of the following graphs is the most likely result obtained in the experiment?
Understanding Bacterial Growth Curves
Bacterial growth in a closed container, starting with ample resources, typically follows a predictable pattern known as the sigmoid or S-shaped growth curve. The experiment measures the total weight, which directly reflects the bacterial biomass.
Analyzing Growth Phases
- Lag Phase: Initial phase with slow growth as bacteria adapt.
- Exponential (Log) Phase: Rapid increase in population size and biomass as resources are abundant.
- Stationary Phase: Growth rate slows down and eventually equals the death rate as resources become limited and waste products accumulate. The population size plateaus.
- Death Phase: Death rate exceeds the growth rate, and the population declines (not always reached or measured in typical experiments focused on initial growth).
Interpreting the Weight Measurement
The weighing machine records the total mass of the container. As the bacterial population multiplies, it adds biomass, increasing the total weight. The rate of weight increase mirrors the population's growth rate.
Identifying the Correct Growth Graph
The most likely graph representing this scenario is one that shows:
- An initial period of slow weight increase (lag phase).
- Followed by a period of rapid weight increase (exponential phase).
- Concluding with a slowing of the weight increase rate until it plateaus (stationary phase).
This pattern corresponds to the sigmoid (S-shaped) growth curve. Observing the provided options, the graph showing an S-shaped curve is the most appropriate representation of bacterial population growth under these experimental conditions.
The graph presented in Option D illustrates this typical sigmoid growth pattern.
Important Questions from Population growth curves
- A flask containing nutrient-rich media is seeded with 100 isogenic bacteria. Assuming that no bacteria die in the flask, after approximately how many generations will the population reach a size of $10^5$?
Population growth of a species can be modelled as $$ \frac{dN(t)}{dt} = rN(t)\left(1 - \frac{N(t)}{K}\right) $$ where $N(t)$ is the population size at time $t$; $r$ is the growth rate; and $K$ is the carrying capacity of the environment.
For $K = 9000$, $\frac{dN(t)}{dt}$ is maximized at $N =$ _____
(Answer in integer)
- The population size at which net recruitment is the highest is also when the greatest amount can be harvested, while ensuring the long-term survival of the population. The amount harvested at this population size is known as
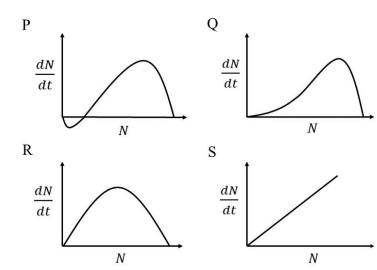
The graphs shown represent the relationship between population size ($N$) and population growth rate ($\frac{dN}{dt}$). Which one of the following growth curves represents a density-dependent population that experiences a strong Allee effect?
Overfishing reduced food availability for sea lions in California, causing a decline in their population size. In 1972, under the US Endangered Species Act, fishing was banned from sea lion foraging areas. Subsequently, the population of sea lions increased in a logistic form as shown in the figure.
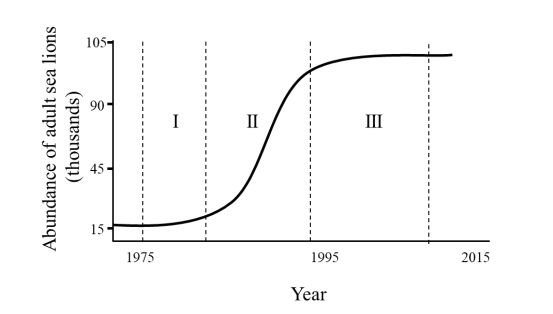
The per capita growth rate is highest in the interval __________ and the population growth rate is highest in the interval __________


