
Bacterial Growth Rate Calculation
This solution calculates the per-capita growth rate ($r$) for a bacterial population experiencing exponential growth over a specific time period.
Exponential Growth Model
Bacterial population growth, when not limited by resources, can be modeled using the exponential growth formula:
$ N(t) = N_0 e^{rt} $
Where:
- $N(t)$ represents the population size at time $t$.
- $N_0$ is the initial population size.
- $r$ is the per-capita growth rate (per unit time).
- $t$ is the time elapsed.
- $e$ is the base of the natural logarithm.
Calculating Per-Capita Rate
The problem provides the following information:
- Initial population, $N_0 = 10^6$ cells.
- Final population, $N(t) = 5.5 \times 10^7$ cells.
- Time interval, $t = 20$ minutes.
To find the per-capita growth rate ($r$), we substitute these values into the exponential growth equation:
$ 5.5 \times 10^7 = 10^6 e^{r \times 20} $
First, isolate the exponential term by dividing both sides by the initial population ($N_0$):
$ \frac{5.5 \times 10^7}{10^6} = e^{20r} $
Simplify the left side:
$ 55 = e^{20r} $
Next, take the natural logarithm ($\ln$) of both sides to solve for the exponent:
$ \ln(55) = \ln(e^{20r}) $
Using the property $\ln(e^x) = x$, we get:
$ \ln(55) = 20r $
Now, solve for $r$ by dividing by 20:
$ r = \frac{\ln(55)}{20} $
Using a calculator, $\ln(55) \approx 4.00733$. Substitute this value:
$ r \approx \frac{4.00733}{20} $
$ r \approx 0.2003665 \text{ per minute} $
Rounding the result to two decimal places, as required:
$ r \approx 0.20 \text{ per minute} $
Therefore, the per-capita growth rate of the bacteria is approximately 0.20 per minute.
Important Questions from Population growth curves
- A flask containing nutrient-rich media is seeded with 100 isogenic bacteria. Assuming that no bacteria die in the flask, after approximately how many generations will the population reach a size of $10^5$?
Population growth of a species can be modelled as $$ \frac{dN(t)}{dt} = rN(t)\left(1 - \frac{N(t)}{K}\right) $$ where $N(t)$ is the population size at time $t$; $r$ is the growth rate; and $K$ is the carrying capacity of the environment.
For $K = 9000$, $\frac{dN(t)}{dt}$ is maximized at $N =$ _____
(Answer in integer)
- The population size at which net recruitment is the highest is also when the greatest amount can be harvested, while ensuring the long-term survival of the population. The amount harvested at this population size is known as
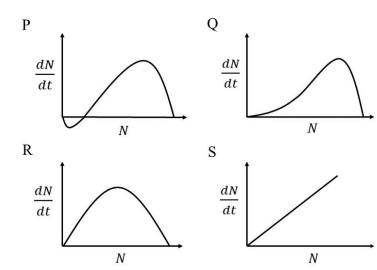
The graphs shown represent the relationship between population size ($N$) and population growth rate ($\frac{dN}{dt}$). Which one of the following growth curves represents a density-dependent population that experiences a strong Allee effect?
Overfishing reduced food availability for sea lions in California, causing a decline in their population size. In 1972, under the US Endangered Species Act, fishing was banned from sea lion foraging areas. Subsequently, the population of sea lions increased in a logistic form as shown in the figure.
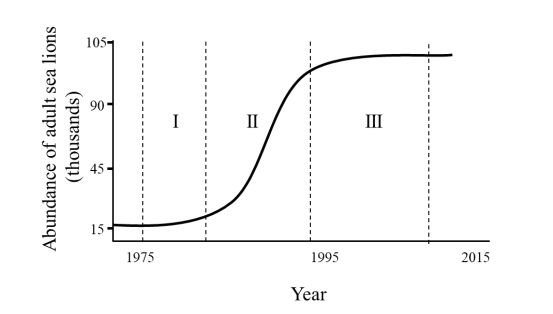
The per capita growth rate is highest in the interval __________ and the population growth rate is highest in the interval __________


