
Identifying Causes of Linkage Disequilibrium
Linkage disequilibrium (LD) describes the situation where specific alleles at different genetic loci are inherited together more often than would be expected by chance. This non-random association is influenced by several factors. Analyzing the options provided helps identify the primary drivers of LD:
-
Option 1: Low recombination rate between loci
A low recombination rate between two loci means that the alleles at these loci are less likely to be separated during meiosis (crossing over). Consequently, alleles that are initially associated tend to be passed down together through generations, maintaining or increasing linkage disequilibrium. This is a significant factor contributing to LD.
-
Option 2: High recombination rate between loci
Conversely, a high recombination rate facilitates the independent assortment of alleles. It frequently breaks down any existing associations between alleles at different loci, thus tending to decrease linkage disequilibrium over time. Therefore, a high recombination rate is not a cause of LD.
-
Option 3: Natural selection
Natural selection can directly influence linkage disequilibrium. If certain combinations of alleles (haplotypes) confer a survival or reproductive advantage, natural selection will favor these combinations. This selection pressure increases the frequency of advantageous haplotypes, leading to increased LD between the loci involved.
-
Option 4: Polyploidy
Polyploidy refers to having more than two complete sets of chromosomes. While polyploidy can alter allele frequencies and potentially influence recombination patterns, it is not considered a direct or primary cause of linkage disequilibrium between two specific loci compared to factors like recombination rate and selection. Its effect on LD is complex and indirect.
Conclusion on Linkage Disequilibrium Factors
Based on the analysis, the factors that can cause or contribute to linkage disequilibrium between alleles at two loci are:
- A low recombination rate between the loci.
- Natural selection favoring specific allele combinations.
Therefore, the correct options are A (Low recombination rate between loci) and C (Natural selection).
Important Questions from Natural selection
- Which one or more of the following is/are NOT essential for evolution by natural selection to take place in a population?
- Two bacterial variants are growing together in the same flask. At any relative frequency of the two variants, the population growth rate of the rarer variant is higher. The above is an example of ________.
There are two species, X and Y, with abundances $x$ and $y$, respectively. Species X has growth rate $\alpha$, and species Y has growth rate $\beta$. Assume that the sum of the species abundances is constant over time, i.e., $x + y = 1$. Let $x$ and $y$ follow the rate equations:
$$\frac{dx}{dt} = \alpha x - \varphi x,$$
$$\frac{dy}{dt} = \beta y - \varphi y,$$ where $\varphi$ is the average species fitness.
Which one of the following options correctly represents the expression for $\varphi$?The figure illustrates the soil zinc tolerance of the grass species Anthoxanthum along a transect from inside a mine to the middle of a pasture outside the mine.
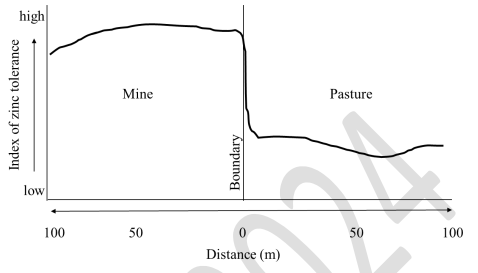
Which one or more of the following processes explain(s) the observed pattern of zinc tolerance in this grass species?From an original population \(P\) of a butterfly species, two experimental populations \(X\) and \(Y\) were established. In \(X\), males and females were maintained in standard conditions, and females were allowed to mate and lay eggs. Only eggs from females laying small clutches (i.e., \(S\) eggs or fewer) were allowed to hatch and the rest were not utilized. In \(Y\), males and females were maintained in standard conditions and females were allowed to mate and lay eggs. From each female, \(S\) eggs were randomly selected and allowed to hatch, and the rest were not utilized. After 20 generations of these experimental conditions, relative to the original population \(P\), and assuming that clutch size is under genetic control, we expect clutch size to be ______________________in \(X\) and ___________________ in \(Y\).


