
Selection Mechanism Explained
The question describes a scenario where the growth rate of a bacterial variant increases as it becomes less common (rarer) in the population.
Understanding Frequency-Dependent Selection
This phenomenon is a form of frequency-dependent selection, where the fitness of a genotype or phenotype depends on its frequency relative to other genotypes or phenotypes in the population.
Negative Frequency-Dependent Selection
- In negative frequency-dependent selection, rare genotypes or phenotypes have higher fitness than common ones.
- As the rarer variant's population grows, its relative advantage decreases. Conversely, if it becomes very common, its growth rate would slow down relative to other variants.
- The condition "growth rate of the rarer variant is higher" directly matches the definition of negative frequency-dependent selection.
Other Options Considered
- Sexual selection: Involves traits that increase mating success, not directly related to population growth rate based on rarity.
- Positive selection: Favors specific traits or alleles, often increasing their frequency, and does not fit the description where rarer variants have higher growth rates.
- Positive frequency-dependent selection: This is the opposite; common variants have higher fitness, and rarer variants have lower fitness.
Conclusion
The described scenario is a clear example of negative frequency-dependent selection because the fitness (growth rate) is inversely related to the variant's frequency.
Important Questions from Natural selection
- Which one or more of the following is/are NOT essential for evolution by natural selection to take place in a population?
There are two species, X and Y, with abundances $x$ and $y$, respectively. Species X has growth rate $\alpha$, and species Y has growth rate $\beta$. Assume that the sum of the species abundances is constant over time, i.e., $x + y = 1$. Let $x$ and $y$ follow the rate equations:
$$\frac{dx}{dt} = \alpha x - \varphi x,$$
$$\frac{dy}{dt} = \beta y - \varphi y,$$ where $\varphi$ is the average species fitness.
Which one of the following options correctly represents the expression for $\varphi$?The figure illustrates the soil zinc tolerance of the grass species Anthoxanthum along a transect from inside a mine to the middle of a pasture outside the mine.
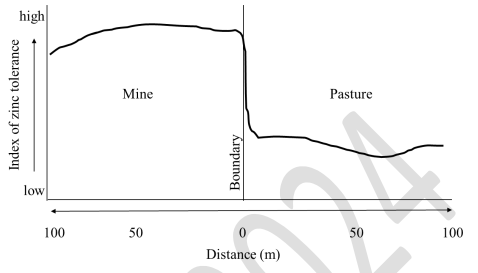
Which one or more of the following processes explain(s) the observed pattern of zinc tolerance in this grass species?From an original population \(P\) of a butterfly species, two experimental populations \(X\) and \(Y\) were established. In \(X\), males and females were maintained in standard conditions, and females were allowed to mate and lay eggs. Only eggs from females laying small clutches (i.e., \(S\) eggs or fewer) were allowed to hatch and the rest were not utilized. In \(Y\), males and females were maintained in standard conditions and females were allowed to mate and lay eggs. From each female, \(S\) eggs were randomly selected and allowed to hatch, and the rest were not utilized. After 20 generations of these experimental conditions, relative to the original population \(P\), and assuming that clutch size is under genetic control, we expect clutch size to be ______________________in \(X\) and ___________________ in \(Y\).
- In which of the following four plots, showing reproductive fitness versus a trait, is the strength of selection MAXIMUM?


