
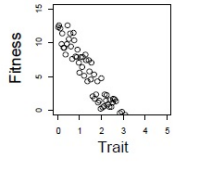
Analyzing Selection Strength in Fitness Plots
The strength of selection refers to how effectively natural selection changes allele frequencies. It is indicated by how sharply reproductive fitness changes in response to changes in a specific trait.
We need to compare the four plots showing the relationship between a trait and reproductive fitness to find the one demonstrating the maximum strength of selection.
Interpreting the Plots
- Plot 1: Shows a steep increase in fitness up to a certain trait value, followed by a steep decrease. This sharp change indicates a strong selective pressure favoring individuals with trait values near the peak.
- Plot 2: Displays a very gradual change in fitness across a wide range of trait values. This signifies weak selection, as fitness is not highly dependent on the specific trait value.
- Plot 3: Presents a moderate curve, suggesting selection is acting on the trait, but the relationship between trait value and fitness is less steep compared to Plot 1.
- Plot 4: Similar to Plot 3, this plot shows selection, but the curve's slope is less pronounced than in Plot 1, indicating weaker selection than Plot 1.
Identifying Maximum Selection Strength
The strength of selection is directly related to the steepness (or curvature) of the fitness function. A steeper curve implies that small changes in the trait value lead to large changes in fitness, hence stronger selection.
Comparing the plots, Plot 1 exhibits the steepest changes in fitness concerning the trait value. This indicates the most intense selective pressure among the given options.
Therefore, the plot showing the maximum strength of selection is the first one.
Important Questions from Natural selection
- Which one or more of the following is/are NOT essential for evolution by natural selection to take place in a population?
- Two bacterial variants are growing together in the same flask. At any relative frequency of the two variants, the population growth rate of the rarer variant is higher. The above is an example of ________.
There are two species, X and Y, with abundances $x$ and $y$, respectively. Species X has growth rate $\alpha$, and species Y has growth rate $\beta$. Assume that the sum of the species abundances is constant over time, i.e., $x + y = 1$. Let $x$ and $y$ follow the rate equations:
$$\frac{dx}{dt} = \alpha x - \varphi x,$$
$$\frac{dy}{dt} = \beta y - \varphi y,$$ where $\varphi$ is the average species fitness.
Which one of the following options correctly represents the expression for $\varphi$?The figure illustrates the soil zinc tolerance of the grass species Anthoxanthum along a transect from inside a mine to the middle of a pasture outside the mine.
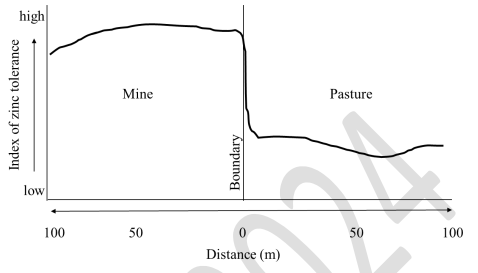
Which one or more of the following processes explain(s) the observed pattern of zinc tolerance in this grass species?From an original population \(P\) of a butterfly species, two experimental populations \(X\) and \(Y\) were established. In \(X\), males and females were maintained in standard conditions, and females were allowed to mate and lay eggs. Only eggs from females laying small clutches (i.e., \(S\) eggs or fewer) were allowed to hatch and the rest were not utilized. In \(Y\), males and females were maintained in standard conditions and females were allowed to mate and lay eggs. From each female, \(S\) eggs were randomly selected and allowed to hatch, and the rest were not utilized. After 20 generations of these experimental conditions, relative to the original population \(P\), and assuming that clutch size is under genetic control, we expect clutch size to be ______________________in \(X\) and ___________________ in \(Y\).


