
The Venn Diagram below shows numbers of species in three forest types. Which of the following statements is true? 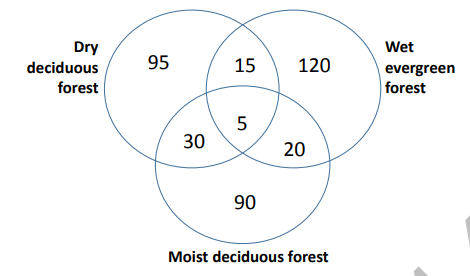
To determine which statement is true, we need to analyze the Venn diagram provided:
The Venn diagram shows the distribution of species among three forest types: Dry deciduous, Moist deciduous, and Wet evergreen.
- Overlap of species between dry deciduous and moist deciduous:
- Species only in Dry and Moist deciduous (excluding the common section with Wet evergreen) = 15 species.
- Overlap of species between moist deciduous and wet evergreen:
- Species only in Moist and Wet evergreen (excluding the common section with Dry deciduous) = 20 species.
By comparing the overlaps:
- \(15 \text{ (dry + moist deciduous)} > 20 \text{ (moist + wet evergreen)}\)
Thus, the statement "Overlap of species between dry deciduous and moist deciduous > overlap between moist deciduous and wet evergreen" is correct.
Let's analyze the other options for verification:
- Overlap of species between wet evergreen and dry deciduous > overlap between wet evergreen and moist deciduous:
- Species only in Wet and Dry deciduous (excluding the common section with Moist deciduous) = 0 (no specific overlap shown).
- \(0 \not> 20\)
- Total species in dry deciduous > moist deciduous:
- Total species in Dry deciduous = 95 + (15) + (5) = 115 species.
- Total species in Moist deciduous = 90 + (30) + (5) = 125 species.
- \(115 \not> 125\)
- Total species in moist deciduous > wet evergreen:
- Total species in Wet evergreen = 120 + (20) + (5) = 145 species.
- \(125 \not> 145\)
Therefore, the correct answer is:
Overlap of species between dry deciduous and moist deciduous > overlap between moist deciduous and wet evergreen
Important Questions from Venn Diagrams
- To pass a test, a candidate needs to answer at least 2 out of 3 questions correctly. A total of 6,30,000 candidates appeared for the test. Question A was correctly answered by 3,30,000 candidates. Question B was answered correctly by 2,50,000 candidates. Question C was answered correctly by 2,60,000 candidates. Both questions A and B were answered correctly by 1,00,000 candidates. Both questions B and C were answered correctly by 90,000 candidates. Both questions A and C were answered correctly by 80,000 candidates. If the number of students answering all questions correctly is the same as the number answering none, how many candidates failed to clear the test?
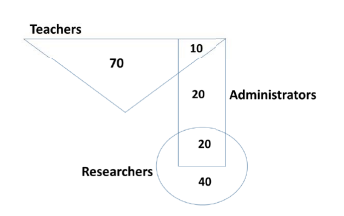
In the given diagram, teachers are represented in the triangle, researchers in the circle and administrators in the rectangle. Out of the total number of the people, the percentage of administrators shall be in the range of ___________.
Out of \(100\) textile companies, \(10\) companies are involved in spinning, weaving and chemical processing, \(25\) companies are involved in spinning and chemical processing, and \(30\) companies are involved in weaving and chemical processing. If \(65\) companies are involved in chemical processing, the number of companies involved {ONLY} in chemical processing is ________________________.
- In a class of 300 students in an M.Tech programme, each student is required to take at least one subject from the following three:
M600: Advanced Engineering Mathematics
C600: Computational Methods for Engineers
E600: Experimental Techniques for Engineers
The registration data for the M.Tech class shows that 100 students have taken M600, 200 students have taken C600, and 60 students have taken E600. What is the maximum possible number of students in the class who have taken all the above three subjects? Each row of Column-I has three items and each item is represented by a circle in Column-II. The arrangement of circles in Column-II represents the relationship among the items in Column-I.
Identify the option that has the most appropriate match between Column-I and Column-II.
Note: The figure shown are representative.
Column-I Column-II (1) Animal, Zebra, Giraffe (P) 
(2) Director, Producer, Actor (Q) 
(3) Word, Sentence, Novel (R) 
(4) Pianist, Guitarist, Instrumentalist (S) 


