
The graph shows the typical test result of a property of a building material. Identify the test and the variables represented on the X-axis and Y-axis from the given options. 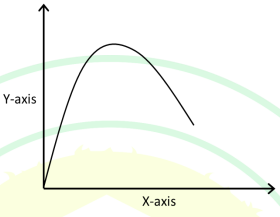
The given graph represents the relationship between the moisture percentage and percentage increase in volume of a sand sample, which is known as the bulking test of sand. Let's analyze and confirm why this is the correct answer among the provided options:
- Workability test of concrete: The workability of concrete is often represented by a slump test, where the X-axis would typically be the water-cement ratio, and the Y-axis would be the slump value. The graph does not match this description since the typical slump test graph would have a direct or indirect proportionality without a peak.
- Cube test of concrete: For compressive strength tests of concrete cubes, the X-axis would be the water-cement ratio, and the Y-axis would be the compressive strength after 28 days. This relationship doesn't fit the bell-shaped curve shown in the graph.
- Ultrasonic pulse velocity test: This test relates pulse velocity on the X-axis and compressive strength on the Y-axis with a linear or non-linear correlation, not a peak curve as shown.
- Bulking test of sand: This test illustrates how the volume of sand increases with moisture content initially before decreasing. The typical graph has moisture percentage on the X-axis and percentage increase in volume on the Y-axis, forming a peak. The given graph matches this description.
The correct answer is the option related to the bulking test of sand. The peak in the graph signifies the point of maximum bulking, where the sand's volume is highest due to the presence of a specific amount of moisture content.
Important Questions from Strength of Materials
- A simply-supported steel beam made of an I-section has a span of $8 \text{ m}$. The beam is carrying a uniformly distributed load of $15 \text{ kN/m}$. The overall depth of the beam is $450 \text{ mm}$. The moment of inertia of the beam section is $18000$ cm$^4$. The maximum bending stress in the beam will be _________ N/mm$^2$. [in integer]
A simply supported RCC beam of cross section $0.4 \text{ m} \times 0.6 \text{ m}$ covers a span of $8 \text{ m}$. It is subjected to a uniformly distributed load of $30 \text{ kN/m}$. If the unit weight of concrete is $24 \text{ kN/m}^3$, the tensile stress (in $N/mm^2$, rounded off to two decimal places) at the bottom of the beam at mid-span is______
A rectangular beam section of size 300 mm (width) X 500 mm (depth) is loaded with a shear force of 600 kN. The maximum shear stress on the section in N/mm² is ___________
- A steel I-beam section is subjected to a bending moment of 96 kN-m. The moment of inertia of the beam section is $24,000 \text{ cm}^4$. The bending stress at 100 mm above the neutral axis of the beam in MPa will be ________
A simply supported beam AB has a clear span of 7 meter. The bending moment diagram (BMD) of the beam due to a single concentrated load is shown in the figure below.
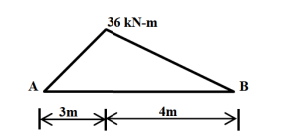
The magnitude of the concentrated load in kN is __________.


