The figure below shows how feeding rate varies with age (old/young) and with body size (small/large) in males of a deer species. Based on this figure, which of the statements below is FALSE?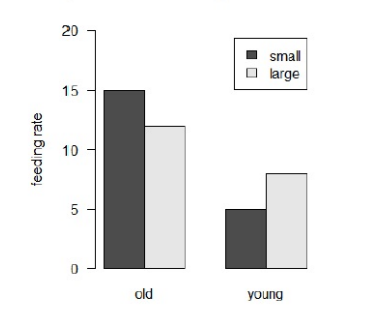
To determine which statement is FALSE based on the figure, let's analyze each option in relation to the given data.
- Statement: Large old males have higher feeding rates than large young males.
- According to the figure, large old males have a higher feeding rate than large young males. Thus, this statement is TRUE.
- Statement: Large young males have higher feeding rates than small young males.
- The figure shows large young males have a higher feeding rate compared to small young males. Thus, this statement is TRUE.
- Statement: Regardless of size, feeding rate is higher in old males than in young males.
- Both small and large old males have higher feeding rates than their young counterparts. Thus, this statement is TRUE.
- Statement: Regardless of age, feeding rate is higher in small males than in large males.
- The figure indicates that large males (both old and young) have higher feeding rates than small males. Thus, this statement is FALSE.
Therefore, the FALSE statement is: Regardless of age, feeding rate is higher in small males than in large males.
Important Questions from Stabilizing selection
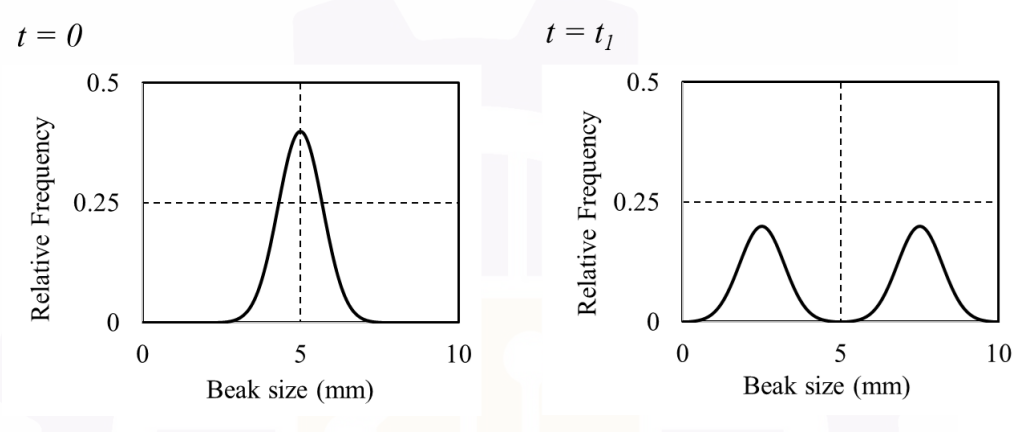
The distributions of beak size in a bird population at two different times are shown below. In going from time $t = 0$ to $t = t_1$, the variance of the distribution in beak size in the population has _________.
- Male rhinoceros beetles have horns that they use to fight each other. Despite the competitive advantage of having large horns, horn length never exceeds two thirds of their body length. What form of selection explains why horn length is constrained?
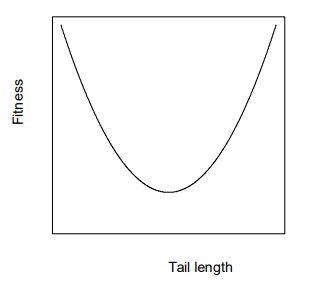
The figure below shows how reproductive fitness varies with tail length in a bird species. Given this pattern, what kind of selection is most likely to act on tail length in this population?