Every society must develop in its people a social responsibility. This is something that we, in India, have been falling short of. We are very individualistic and don't relate ourselves to our society as such. Very seldom do we actually go out and do something, which is beneficial to the society and which does not have a side-benefit for ourselves, as individuals and this is another thing that must be built into the education system. Our young boys and girls coming out must have a feeling for our society. There is a special responsibility that you have, that we all have in building up the spirit. We have to see that what we learn is not used only for our own personal benefits, that every task we do is such that it benefits the weak and the poor, as Gandhiji has said. India, today, is striving out into the modern world. We are looking ahead to new technology, to high technology, new methods, new types of employment and a new dynamism in our economic growth. But while we look ahead, we must not forget the millions who are still below the poverty line. When we look at technology, when we look at science, when we look at development, our attention must not be diverted from what is still a major block in India - the poor and deprived groups and everything we do must be targeted in a manner that the benefit will flow to the weak, the deprived and the depressed.
Technology Benefits for Poor and Weak
The question asks for the author's main suggestion regarding new technology and its beneficiaries.
- Option 1 posits that new technology should primarily benefit the poor and the weak.
- Option 2 suggests that the poor and weak are the producers of new technology, which is a different concept.
- Option 3 proposes that technology should help the rich, contradicting the likely intent of progressive suggestions.
- Option 4 claims technology is useless to the poor and weak, an extreme and generally unsupported view.
Based on the common discourse surrounding technological advancement and social equity, the author's suggestion aligns with the idea that innovation should serve the most vulnerable populations.
Therefore, the author suggests that the poor and the weak must benefit from new technology.
Similar Questions
Match List - I with List - II.
List - I List - II A. Apple, Orange, Fruits I. 
B. Son, Mother, Father II. 
C. Cat, Dog, Elephant III. 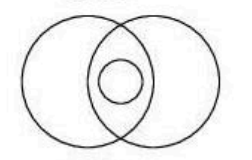
D. Player, Cricket, Ground IV. 
Choose the correct answer from the options given below :For the sets $A=\{0, 1, 2, 3\}$, $B=\{2, 3\}$, $C=\{1, 2, 4\}$, Match List - I with List - II.
List - I List - II A. $A - B$ I. $\{2\}$ B. $B \cap C$ II. $A$ C. $A \cup B$ III. $\{1, 2\}$ D. $A \cap C$ IV. $\{0, 1\}$ Choose the correct answer from the options given below :
Match List - I with List - II : On the basis of share of expenditure in given pie chart.
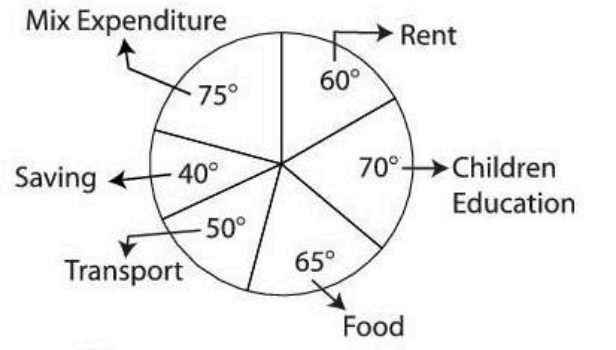
List - I List - II A. Percentage of Expenditure on Rent I. $11.11$ B. Percentage of Expenditure on Transport II. $13.89$ C. Percentage of Expenditure on Saving III. $16.67$ D. Percentage of Expenditure on Food IV. $18.06$ Choose the correct answer from the options given below :
- According to the author, the Indian people
- Indians do not do anything beneficial to society unless
- The author says that India
- What value does the author want to build into the educational system ?
- Given below are two statements: one is labelled as Assertion (A) and the other is labelled as Reason (R).
Assertion (A): All even numbers are divisible by two.
Reason (R) : An even number is defined as a number divisible by two.
In the light of the above statements, choose the most appropriate answer from the options given below: - Given below are two statements : one is labelled as Assertion (A) and the other is labelled as Reason (R).
Assertion (A) : Iron rusts faster in moist air.
Reason (R) : Moisture accelerates the oxidation process.
In the light of the above statements, choose the most appropriate answer from the options given below : - Given below are two statements : one is labelled as Assertion (A) and the other is labelled as Reason (R).
Assertion (A) : Rabindranath Tagore won the Nobel Prize in Literature for Geetanjali.
Reason (R) : Geetanjali is a collection of poems reflecting spiritual themes.
In the light of the above statements, choose the most appropriate answer from the options given below :
Important Questions from Mixed Topic (CUET PG)
- Kalpsutra, the illustrated canonical text is from:-
- The Harappan city almost exclusively devoted to craft production was-:
- Mohandas Karamchand Gandhi launched quit India movement after the failure of:-
- The "Objectives Resolution" was introduced in constituent assembly by:-
- Who among the following was not a member of the constituent assembly:-