
In the above diagram, the consumer surplus is represented by the area of :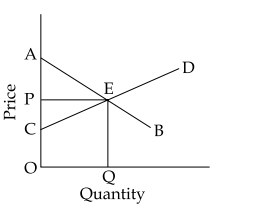
The concept of consumer surplus is a key idea in Business Economics. It refers to the difference between the total amount that consumers are willing to pay for a good or service (represented by the demand curve) and the total amount they actually pay (the market price).
In the diagram, the demand is represented by the downward sloping line, and the supply by the upward sloping line. The point where they intersect, labeled E, indicates the equilibrium price (P) and quantity (Q).
Consumer surplus is typically shown as the area under the demand curve and above the price level, up to the quantity traded. It is represented by the area of the triangle formed by:
- The vertical axis (Price) from P to A.
- The horizontal line (Price) from P to Q.
- The demand curve from A to E.
The correct area representing the consumer surplus is \(\Delta APE\).
Let's analyze why this is correct:
- \(\Delta APE\)- This area is above the price level PE and below the demand curve AE, which conforms to the definition of consumer surplus.
- Other options such as \(\Delta PCE\), \(\Delta ACE\), and Rectangle OPEQ do not represent the consumer surplus:
- \(\Delta PCE\)is below the price level and from the equilibrium point downwards, representing no surplus.
- \(\Delta ACE\)encompasses the entire area under the demand curve, not confined above price level P only.
- Rectangle OPEQ includes both consumer and producer surplus, not exclusively consumer surplus.
Hence, the correct answer is \(\Delta APE\), which accurately captures the area of consumer surplus.
Important Questions from Consumer behaviour
- Organization responsible for preventing unfair or deceptive trade practices in textile and textile products is :
- The urge to possess and consume for display of wealth is called :
- Which of the following factors favour fashion ?
(a) Leisure
(b) An economy of abundance
(c) Transportation and communication
(d) Low income
(e) Sumptuary laws
Code : - Arrange the following Acts in the ascending order of their years of enactment :
(a) Environmental Protection Act
(b) MRTP
(c) PFA
(d) ISI Certification Marks Act
(e) Air Pollution Act - Match the quality marks given in List - I with their respective applications given in List - II :
List - I List - II (a) Eco mark (i) Product certification (b) Hallmark (ii) Agricultural marketing (c) ISI mark (iii) Land identification (d) AGMARK (iv) Environmental friendly products (v) Organizational standards (vi) Jewellery


