
Calculating Percentage of Employees Drinking Neither Beverage
This problem involves finding the percentage of employees who belong to neither the 'tea drinkers' group nor the 'coffee drinkers' group.
We are given:
- Percentage of employees drinking coffee, \( P(C) = 35\% \)
- Percentage of employees drinking tea, \( P(T) = 40\% \)
- Percentage of employees drinking both tea and coffee, \( P(C \cap T) = 10\% \)
Applying the Inclusion-Exclusion Principle
To find the percentage of employees who drink at least one of the beverages (coffee or tea or both), we use the Principle of Inclusion-Exclusion:
$ P(C \cup T) = P(C) + P(T) - P(C \cap T) $Substituting the given values:
$ P(C \cup T) = 35\% + 40\% - 10\% $ $ P(C \cup T) = 75\% - 10\% $ $ P(C \cup T) = 65\% $This means 65% of the employees drink either coffee or tea or both.
Determining Percentage Drinking Neither Beverage
The total percentage of employees is 100%. To find the percentage of employees who drink neither tea nor coffee, we subtract the percentage of those who drink at least one beverage from the total:
$ \text{Percentage drinking neither} = 100\% - P(C \cup T) $ $ \text{Percentage drinking neither} = 100\% - 65\% $ $ \text{Percentage drinking neither} = 35\% $Therefore, 35% of the employees drink neither tea nor coffee.
Important Questions from Venn Diagram
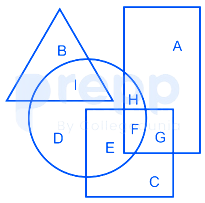
In the following figure, square represents Priests, triangle represents singers, circle represents Therapists and rectangle represents Indians. Which set of of letters represents Indians who are not priests?
Study the given diagram carefully and answer the question. The numbers in different sections indicate the number of persons.
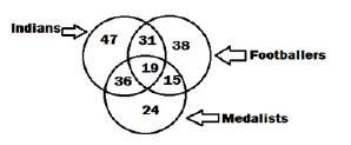
How many such medallists are there who are also Indians?
Study the given diagram carefully and answer the question. The numbers in different sections indicate the number of persons.
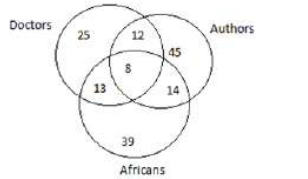
How many Africans are there who are also authors?
Identify the diagram that best represents the relationship among classes given below: Universe, Stars, Sun
Which one of the following diagrams represents the relationship between Insects, Flies and Dogs?


