Study the pie chart and answer the question that follows.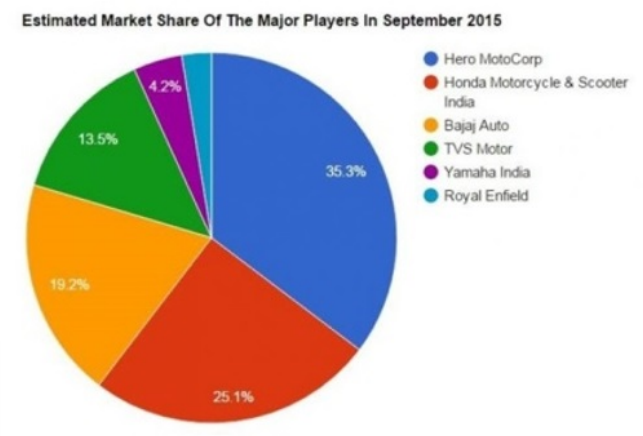
What is the approximate difference between the area (in degrees) of Pool A and Pool B?
The question asks for the approximate difference in degrees between two pools of companies based on their market share. Pool A consists of the 3 companies with the largest market share, and Pool B includes the remaining companies.
Market Share Degree Calculation
A full circle represents a total market share of 100% or $360^\circ$. Therefore, 1% of the market share corresponds to $3.6^\circ$ ($360^\circ / 100$).
Pool Definitions
- Pool A: The 3 companies with the largest market share.
- Pool B: The remaining companies.
Calculation Approach
To find the difference in degrees:
- Determine the total market share percentage ($ P_A $) for the 3 companies in Pool A. This requires the specific market share data which is not provided.
- Convert Pool A's market share percentage to degrees: $ \text{Degrees}_A = P_A \times 3.6 $.
- Calculate the market share percentage for Pool B: $ P_B = 100\% - P_A $.
- Convert Pool B's market share percentage to degrees: $ \text{Degrees}_B = P_B \times 3.6 $ (or $ \text{Degrees}_B = 360^\circ - \text{Degrees}_A $).
- Calculate the absolute difference: $ | \text{Degrees}_A - \text{Degrees}_B | $.
Applying the Provided Answer
Since the specific market share data is missing, we can work backward from the given correct answer ($213^\circ$) to understand the relationship.
Let $ \text{Degrees}_A $ be the total degrees for Pool A and $ \text{Degrees}_B $ be the total degrees for Pool B.
We have two equations:
- $ \text{Degrees}_A + \text{Degrees}_B = 360^\circ $ (Total degrees in a circle)
- $ | \text{Degrees}_A - \text{Degrees}_B | = 213^\circ $ (The required difference)
Assuming Pool A has a larger share than Pool B ($ \text{Degrees}_A > \text{Degrees}_B $):
$ \text{Degrees}_A - \text{Degrees}_B = 213^\circ $
Add the two equations:
$ (\text{Degrees}_A + \text{Degrees}_B) + (\text{Degrees}_A - \text{Degrees}_B) = 360^\circ + 213^\circ $
$ 2 \times \text{Degrees}_A = 573^\circ $
$ \text{Degrees}_A = \frac{573^\circ}{2} = 286.5^\circ $
Now, find $ \text{Degrees}_B $:
$ \text{Degrees}_B = 360^\circ - \text{Degrees}_A = 360^\circ - 286.5^\circ = 73.5^\circ $
The difference is $ 286.5^\circ - 73.5^\circ = 213^\circ $, which matches the provided answer.
This calculation shows that Pool A represents approximately $ \frac{286.5}{3.6} \approx 79.6\% $ of the market share, and Pool B represents approximately $ \frac{73.5}{3.6} \approx 20.4\% $. The difference of $213^\circ$ is consistent with these proportions.
Similar Questions
- A student represents his scores in Mathematics, Statistics and Economics examinations in a pie chart. The central angle for Mathematics is $180^{\circ}$. He scored $80$ in Statistics and $70$ in Economics. His score in Mathematics is:
- What is the percentage of the market share of Royal Enfield?
- The total of Honda Motorcycles & Scooter India and TVS Motors is almost double of which company's market share?
- How much degree of the area is covered by the Yamaha India and Hero MotoCorp's market share in the pie chart?
- If the authors' royalties amount to ₹24,000, then, what will be the cost of paper (in ₹)?
- If the printing charges amount to ₹30,000, then what will be the total expenditure incurred in bringing out the book.
- If the total expenditure in bringing out the book is ₹2,50,000, then what will be the amount of printing charges plus authors' royalties?
- What will be the angle of the sector for miscellaneous expenses?
The given pie chart shows the viewers watching different types of channels on TV.
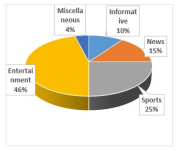
Assuming that the TV watching population is 10,000 people, by what percentage would Sports Channels have to grow their viewership in order to equal the current viewership of the Entertainment channels?Read the given information and answer the question that follows.
The given pie chart shows the game-wise distribution of matches in a tournament.
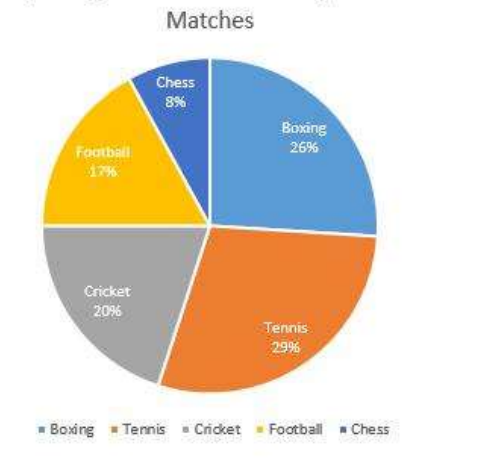
If a total of 300 matches were played, then how many matches were played for football?
Important Questions from Pie Chart
The given pie-diagram shows the expenditure incurred on the preparation of a book by a publisher, under various heads. Study the pie-diagram and answer the question that follows.
Various Expenditures (in percentage) incurred in Publishing a Book
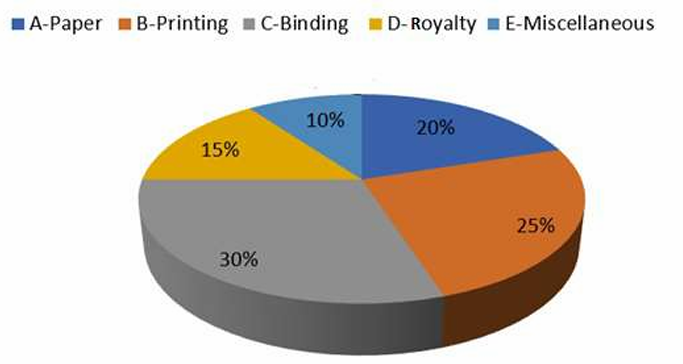
The marked price of a book is 20% more than the CP. If the marked price of the book is ₹30, then what is the cost of paper used in a single copy of the book?
Study the given pie-charts and answer the question that follows.
The pie-charts show the characteristics of foreign tourists visiting India during a given year.
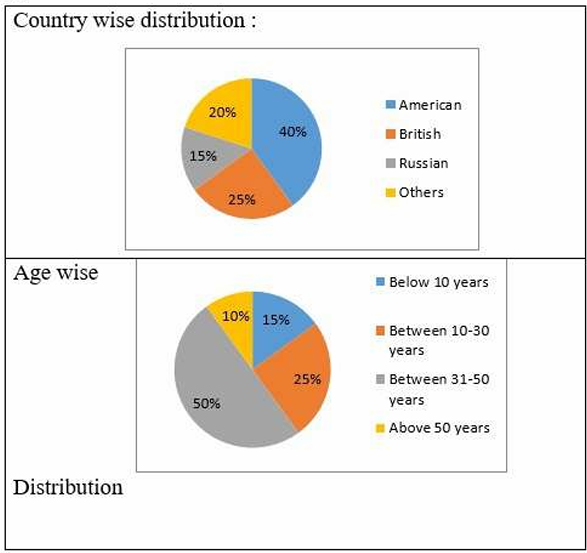
If in a given year, 2,50,000 tourists visited India and the age-wise distribution of data applies to all the countries, then the number of Russian tourists who visited India during the year and were in the age group above 50 years is:
A battery manufacturer manufactures five different types of batteries. The total revenue for the year 2020 is Rs.25,00,000, and 20,000 units were exported in 2020. The distribution of revenue and units for the five different types of batteries is shown in the charts.
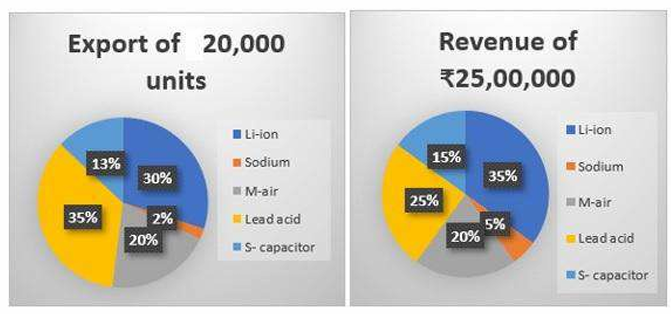
Which type of battery provides the lowest revenue per unit?
What type of chart is used to compare parts of a whole in MS-Excel?
The average of two numbers is M. If one number is N, then the other number is: