
Human Preference Persistence for High Calorie Foods
The question examines the likely evolution of human food preferences over 200 years, given a current preference for high-calorie foods, reduced life expectancy due to this preference, and a maximum reproductive age.
Analysis of Evolutionary Factors
Key factors to consider are:
- Innate Preference: Humans naturally prefer high-calorie foods, a trait likely rooted in evolutionary survival needs.
- Life Expectancy vs. Reproduction: Life expectancy is reduced from 85 to 74 years. However, the maximum reproductive age is 70 years. This means individuals can still reproduce successfully within their lifespan, even with the reduced expectancy.
- Timescale: 200 years is a relatively short period for significant evolutionary shifts in complex preferences.
Evaluating Potential Evolutionary Outcomes
Based on the factors above, let's analyze the options:
- Evolutionary Shift to Low Calorie Preference: A complete reversal of a deeply ingrained preference is unlikely in just 200 years. Evolutionary pressures would need to be exceptionally strong and sustained against the preference itself.
- Genetic Adaptation for Life Expectancy on High Calorie Foods: While possible over longer timescales, developing specific genes to counteract the negative effects of high-calorie diets might not be the *most likely* immediate outcome compared to the persistence of the existing preference.
- Evolution of Enzymes for Low Calorie Foods: Similar to the first point, this assumes a shift away from high-calorie foods, which contradicts the stated strong preference.
- Continued Preference for High Calorie Foods: Given the strong innate preference and the fact that reproduction occurs before the full negative impact on lifespan significantly hinders the species' ability to reproduce, this preference is likely to persist in the short term (200 years). Natural selection hasn't had sufficient time or pressure to strongly select against this preference itself.
Therefore, the most probable outcome is the continuation of the existing preference for high-calorie foods within the given timeframe.
Important Questions from Natural selection
- Which one or more of the following is/are NOT essential for evolution by natural selection to take place in a population?
- Two bacterial variants are growing together in the same flask. At any relative frequency of the two variants, the population growth rate of the rarer variant is higher. The above is an example of ________.
There are two species, X and Y, with abundances $x$ and $y$, respectively. Species X has growth rate $\alpha$, and species Y has growth rate $\beta$. Assume that the sum of the species abundances is constant over time, i.e., $x + y = 1$. Let $x$ and $y$ follow the rate equations:
$$\frac{dx}{dt} = \alpha x - \varphi x,$$
$$\frac{dy}{dt} = \beta y - \varphi y,$$ where $\varphi$ is the average species fitness.
Which one of the following options correctly represents the expression for $\varphi$?The figure illustrates the soil zinc tolerance of the grass species Anthoxanthum along a transect from inside a mine to the middle of a pasture outside the mine.
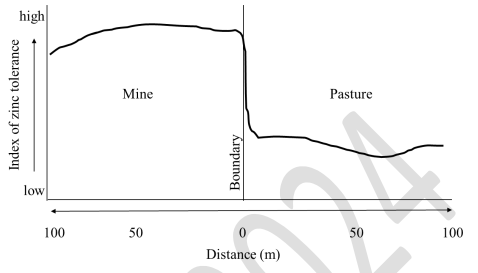
Which one or more of the following processes explain(s) the observed pattern of zinc tolerance in this grass species?From an original population \(P\) of a butterfly species, two experimental populations \(X\) and \(Y\) were established. In \(X\), males and females were maintained in standard conditions, and females were allowed to mate and lay eggs. Only eggs from females laying small clutches (i.e., \(S\) eggs or fewer) were allowed to hatch and the rest were not utilized. In \(Y\), males and females were maintained in standard conditions and females were allowed to mate and lay eggs. From each female, \(S\) eggs were randomly selected and allowed to hatch, and the rest were not utilized. After 20 generations of these experimental conditions, relative to the original population \(P\), and assuming that clutch size is under genetic control, we expect clutch size to be ______________________in \(X\) and ___________________ in \(Y\).


