Given below are two statements : one is labelled as Assertion (A) and the other is labelled as Reason (R).
Assertion (A) : The production of organisation can be shown below by bar chart.
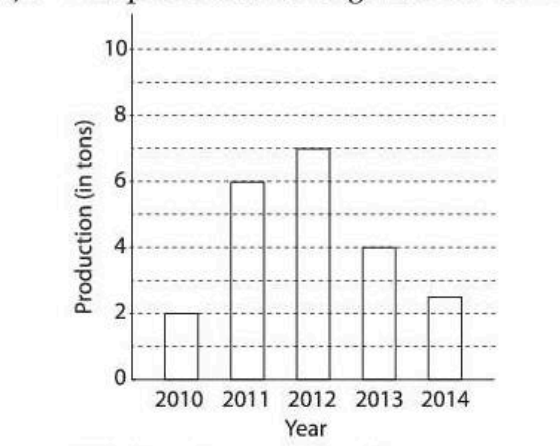
This bar chart can be also represented in pie chart.
Reason (R) : Bar graph can be converted in pie chart form.
In the light of the above statements, choose the most appropriate answer from the options given below :
The given question involves analyzing two statements: an Assertion (A) and a Reason (R). Let's break down each component and determine the correct answer.
Assertion (A): The production of an organisation can be shown using a bar chart.
Reason (R): A bar graph can be converted into a pie chart.
Analysis:
Assertion (A): The bar chart provided shows the production data of an organisation across different years. A bar chart is a graphical representation used to show categorical data with rectangular bars. It is indeed a valid way to represent organisational production data over time.
Reason (R): A pie chart is another form of graphical representation that displays data in a circular graph. Each slice of the pie represents a proportion of the whole. Bar charts and pie charts are interchangeable if the data represents parts of a whole or categorical data distribution. Therefore, it is correct to say that a bar graph can be converted into a pie chart.
Conclusion:
Both the Assertion (A) and the Reason (R) are correct. Furthermore, the Reason (R) provides a correct explanation for why a bar chart can be represented as a pie chart. Hence, the most appropriate answer is:
Correct Option: Both (A) and (R) are correct and (R) is the correct explanation of (A).
Similar Questions
Match List - I with List - II.
List - I List - II A. Apple, Orange, Fruits I. 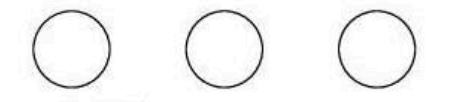
B. Son, Mother, Father II. 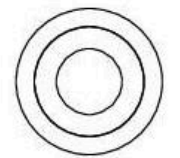
C. Cat, Dog, Elephant III. 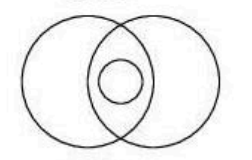
D. Player, Cricket, Ground IV. 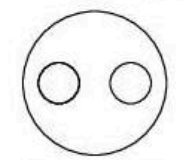
Choose the correct answer from the options given below :For the sets $A=\{0, 1, 2, 3\}$, $B=\{2, 3\}$, $C=\{1, 2, 4\}$, Match List - I with List - II.
List - I List - II A. $A - B$ I. $\{2\}$ B. $B \cap C$ II. $A$ C. $A \cup B$ III. $\{1, 2\}$ D. $A \cap C$ IV. $\{0, 1\}$ Choose the correct answer from the options given below :
Match List - I with List - II : On the basis of share of expenditure in given pie chart.
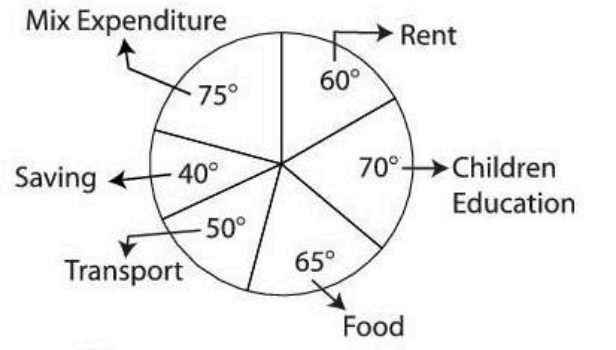
List - I List - II A. Percentage of Expenditure on Rent I. $11.11$ B. Percentage of Expenditure on Transport II. $13.89$ C. Percentage of Expenditure on Saving III. $16.67$ D. Percentage of Expenditure on Food IV. $18.06$ Choose the correct answer from the options given below :
- According to the author, the Indian people
- Indians do not do anything beneficial to society unless
- The author says that India
- The author suggests that
- What value does the author want to build into the educational system ?
- Given below are two statements: one is labelled as Assertion (A) and the other is labelled as Reason (R).
Assertion (A): All even numbers are divisible by two.
Reason (R) : An even number is defined as a number divisible by two.
In the light of the above statements, choose the most appropriate answer from the options given below: - Given below are two statements : one is labelled as Assertion (A) and the other is labelled as Reason (R).
Assertion (A) : Iron rusts faster in moist air.
Reason (R) : Moisture accelerates the oxidation process.
In the light of the above statements, choose the most appropriate answer from the options given below :
Important Questions from Mixed Topic (CUET PG)
- Kalpsutra, the illustrated canonical text is from:-
- The Harappan city almost exclusively devoted to craft production was-:
- Mohandas Karamchand Gandhi launched quit India movement after the failure of:-
- The "Objectives Resolution" was introduced in constituent assembly by:-
- Who among the following was not a member of the constituent assembly:-