
From this, if we want to further visualize the Sales Quantity for each combination of Product Type, Month and State, which of the following OLAP operations should be performed?
OLAP Operation for Data Cube Granularity Change
The question asks to change the visualization level from Country to State for Sales Quantity data, which is currently visualized by Product Type, Month, and Country.
This change requires moving from a higher level of geographical aggregation (Country) to a lower, more detailed level (State). This process of decomposing data into more detailed components is achieved through a specific OLAP operation.
Understanding OLAP Operations
Let's analyze the relevant OLAP operations:
- Slicing: This operation selects a subset of the data cube by fixing one dimension to a single value. For example, selecting sales for only one specific 'Country'. This does not change the granularity of the other dimensions.
- Dicing: This involves selecting a smaller sub-cube by choosing specific ranges or multiple values across multiple dimensions. While it reduces the data size, it doesn't inherently change the hierarchical level of a dimension.
- Roll-up: This operation aggregates data by moving up a dimension's hierarchy, effectively reducing granularity. For example, aggregating monthly sales to quarterly or yearly sales, or aggregating state sales to country sales.
- Drill-down: This operation involves decomposing data by moving down a dimension's hierarchy, increasing granularity. In this case, moving from the Country level down to the State level is an example of drill-down.
Selecting the Correct Operation
To visualize Sales Quantity for each combination of Product Type, Month, and State, starting from a cube that includes Country, we need to increase the detail level within the geographical dimension. The Drill-down operation allows us to navigate from a general level (Country) to a more specific level (State).
Therefore, the appropriate OLAP operation is Drill-down.
Important Questions from Data Warehouse Modelling
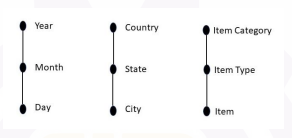
Consider the concept hierarchies as shown in the figure.
Which of the following options denotes the total number of possible data cuboids from these concept hierarchies?
Consider a fact table in an OLAP application: Facts(D1, D2, val), where D1 and D2 are its dimension attributes and val is a dependent attribute. Suppose attribute D1 takes 3 values and D2 takes 2 values, and all combinations of these values are present in the table Facts. How many tuples are there in the result of the following query?
SELECT D1, D2, sum(val)
FROM Facts
GROUP BY CUBE (D1, D2);


