
A particle of mass $m$ and energy $E > 0$, in one dimension is scattered by the potential shown below. If the particle was moving from $x = -\infty$ to $x = \infty$, which of the following graphs gives the best qualitative representation of the wavefunction of this particle?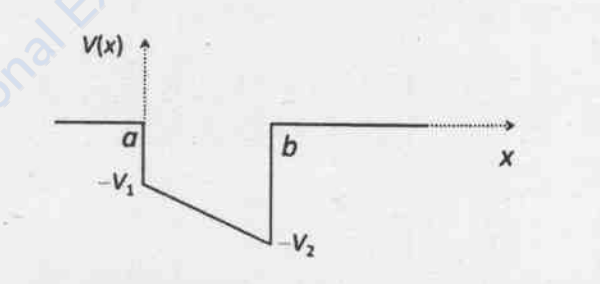
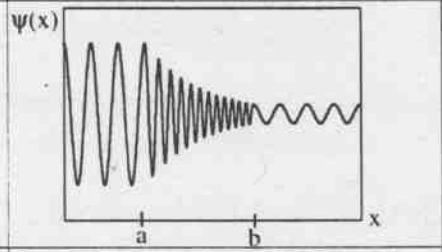
To solve this problem, we need to analyze the wavefunction behavior for a particle with energy \(E>0\) moving through the potential illustrated above.
The potential is a step potential, with different constant values between regions. These regions can significantly affect the wavefunction of a quantum particle.
- For \(x \lt a\), the potential is \(-V_1\), a constant negative value. Because \(E \gt -V_1\), the particle will have classically allowed motion and the wavefunction will oscillate.
- At \(x = a\), the potential steps from \(-V_1\) to \(-V_2\). If \(V_1 \gt V_2\), as it appears from the diagram, this step down in potential will cause a partial reflection and transmission, meaning that there will be a change in the wavefunction's amplitude.
- For \(x \gt b\), since the potential is zero, the particle moves freely with the energy \(E\). The wavefunction will continue oscillating but with a different amplitude than in the \(x \lt a\) region due to potential changes.
Therefore, the wavefunction is expected to oscillate throughout the regions, with changes in amplitude at each potential boundary.
The correct qualitative representation of the wavefunction for the given potential is shown in the above graph. It correctly represents oscillatory behavior in all regions with amplitude changes due to the potential steps, as the particle moves from \(x = -\infty\) to \(x = \infty\).
This is why the wavefunction given in the correct answer graph is the most accurate representation according to the principles of quantum mechanics.
Important Questions from Scattering Theory
- A phase shift of $30^\circ$ is observed when a beam of particles of energy $0.1$ MeV is scattered by a target. When the beam energy is changed, the observed phase shift is $60^\circ$. Assuming that only s-wave scattering is relevant and that the cross-section does not change with energy, the beam energy is
- Consider the potential
$$V(\vec{r}) = \sum_i V_0 a^3 \delta^{(3)}(\vec{r} - \vec{r}_i)$$
where $\vec{r}_i$ are the position vectors of the vertices of a cube of length $a$ centered at the origin and $V_0$ is a constant. If $V_0 a^2 \ll \frac{\hbar^2}{m}$, the total scattering cross-section, in the low-energy limit, is - A particle of energy $E$ scatters off a repulsive spherical potential
$V(r) = \begin{cases} V_0 & \text{for } r < a \\ 0 & \text{for } r \ge a \end{cases}$
where $V_0$ and $a$ are positive constants. In the low energy limit, the total scattering cross-section is $\sigma = 4\pi a^2 \left(\frac{1}{ka}\tanh ka - 1\right)^2$, where $k^2 = \frac{2m}{\hbar^2}(V_0 - E) > 0$. In the limit $V_0 \to \infty$ the ratio of $\sigma$ to the classical scattering cross-section off a sphere of radius $a$ is - In the partial wave expansion, the differential scattering cross-section is given by
$$ \frac{d\sigma}{d(\cos\theta)} = \left| \sum_l (2l+1)e^{i\delta_l} \sin\delta_l P_l(\cos\theta) \right|^2 $$
where $\theta$ is the scattering angle. For a certain neutron-nucleus scattering, it is found that the two lowest phase shifts $\delta_0$ and $\delta_1$ corresponding to $s$-wave and $p$-wave, respectively, satisfy $\delta_1 \approx \delta_0/2$. Assuming that the other phase shifts are negligibly small, the differential cross-section reaches its minimum for $\cos\theta$ equal to - The range of the inter-atomic potential in gaseous hydrogen is approximately $5\text{ \AA}$. In thermal equilibrium, the maximum temperature for which the atom-atom scattering is dominantly $s$-wave, is


