
A nationalized bank has found that the daily balance available in its savings accounts follows a normal distribution with a mean of Rs. 500 and a standard deviation of Rs. 50. The percentage of savings account holders, who maintain an average daily balance more than Rs 500 is _______
Concept:
The normal distribution is symmetric with respect to the mean position and the standard normal variate is given by the relation.
Let variate be x
\({\rm{z}} = \frac{{{\rm{x}} - {\rm{M}}}}{{\rm{σ }}}\)
Where z = Normal variate, M = Mean, σ = Standard deviation
For P(z ≥ 0) = P(z < 0) = 0.5 or 50%
Calculation:
Given:
M = 500
σ = 50
P(x > 500) = ?
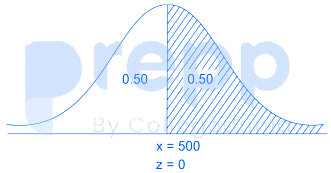
Where X follows the normal distribution
We know that standard normal variable
\({\rm{z}} = \frac{{{\rm{x}} - {\rm{M}}}}{{\rm{σ }}}\)
converting into normalized form
x = 50z + 500
given, x > 500, therefore
50z + 500 > 500 or z > 0
probability, P(z > 0) = 0.5
∴ P(x > 500) = 0.5 or 50%
For x = 500, the standard normal variate is
\({\rm{z}} = \frac{{500 - 500}}{{50}} = 0\)
∴ P(x > 500) = P(z > 0) = 0.50 or 50%(See figure)
Important Questions from Continuous Distributions
Probability density function of a random variable X is given below
\(f\left( x \right) = \left\{ {\begin{array}{*{20}{c}} {0.25}&{if\;1 \le x \le 5}\\ 0&{otherwise} \end{array}} \right.\)
P (X ≤ 4) is
The variable x takes a value between 0 and 10 with uniform probability distribution. The variable y takes a value between 0 and 20 with uniform probability distribution. The probability of the sum of variables (x + y) being greater than 20 is _________
The number of parameters in the univariate exponential and Gaussian distributions, respectively are
Find the value of λ such that the function f (x) is a valid probability density function. _______
\(f\left( x \right)\begin{array}{*{20}{c}} { = \lambda \left( {x - 1} \right)\left( {2 - x} \right)}&{for1 \le x \le 2}\\ { = 0}&{otherwise} \end{array}\)
- The annual precipitation data of a city is normally distributed with mean and standard deviation as 1000 mm and 200 mm, respectively. The probability that the annual precipitation will be more than 1200 mm is


