
Which one of the following summary measures denotes the degree of lopsidedness in a distribution?
Measures of skewness
Understanding Distribution Lopsidedness with Skewness
The question asks about the summary measure used to describe the degree of lopsidedness in a statistical distribution. Lopsidedness refers to the asymmetry of the distribution. Let's look at the options provided:
Exploring Measures of Distribution Shape and Location
Statistical summary measures help us understand different characteristics of a dataset's distribution. These include measures of central tendency, variation, and shape.
- Measures of Central Tendency: These tell us about the center or typical value of the data. Examples include the mean, median, and mode. They do not describe the symmetry or asymmetry of the distribution.
- Measures of Variation: These describe the spread or dispersion of data points. Examples include range, variance, and standard deviation. They tell us how spread out the data is but not about its shape.
- Measures of Skewness: This is a measure of the asymmetry of the probability distribution of a real-valued random variable about its mean. It quantifies how much the distribution is skewed to one side. A distribution is skewed if one tail is longer than the other. This directly relates to the "lopsidedness" mentioned in the question.
- Measures of Kurtosis: This measure describes the "tailedness" or peakedness of a distribution relative to a normal distribution. It tells us if the tails of the distribution contain extreme values (outliers) more or less than a normal distribution, and if the peak is sharper or flatter. It does not measure lopsidedness or asymmetry directly.
Skewness: The Measure of Lopsidedness
Skewness indicates the direction and magnitude of a distribution's asymmetry. There are generally three types:
- Symmetric Distribution: If the distribution is perfectly symmetric (like a normal distribution), the skewness is zero. The mean, median, and mode are typically equal in a perfectly symmetric unimodal distribution.
- Positively Skewed (Right-Skewed) Distribution: The tail on the right side of the distribution is longer or fatter than the left side. This means there are more extreme values on the higher end. In a positively skewed distribution, the mode is usually less than the median, which is less than the mean ($\text{Mode} < \text{Median} < \text{Mean}$). The distribution is lopsided towards the higher values.
- Negatively Skewed (Left-Skewed) Distribution: The tail on the left side of the distribution is longer or fatter than the right side. This means there are more extreme values on the lower end. In a negatively skewed distribution, the mean is usually less than the median, which is less than the mode ($\text{Mean} < \text{Median} < \text{Mode}$). The distribution is lopsided towards the lower values.
Several coefficients can be used to quantify skewness, such as Pearson's coefficient of skewness or the moment coefficient of skewness.
For example, Pearson's first coefficient of skewness is given by: $$ \text{Skewness} = \frac{\text{Mean} - \text{Mode}}{\text{Standard Deviation}} $$ And Pearson's second coefficient of skewness (useful when the mode is not well-defined) is: $$ \text{Skewness} = \frac{3 (\text{Mean} - \text{Median})}{\text{Standard Deviation}} $$
Comparing Summary Measures
| Measure Type | What it Describes | Related Concept |
|---|---|---|
| Central Tendency | Center or typical value | Location |
| Variation | Spread or dispersion | Scale |
| Skewness | Asymmetry or lopsidedness | Shape |
| Kurtosis | Tailedness or peakedness | Shape |
Based on the definitions, measures of skewness are specifically designed to quantify the degree of lopsidedness or asymmetry in a distribution.
Revision Table: Key Statistical Summary Measures
| Measure Category | Examples | Purpose |
|---|---|---|
| Measures of Central Tendency | Mean, Median, Mode | Locating the center of the data |
| Measures of Variation/Dispersion | Range, Variance, Standard Deviation, Interquartile Range | Measuring the spread of the data |
| Measures of Shape | Skewness, Kurtosis | Describing the form of the distribution |
Additional Information on Distribution Shape
Understanding the shape of a distribution is crucial in statistics. Skewness and kurtosis are the two primary measures used to describe a distribution's shape.
- Symmetry vs. Asymmetry: A distribution is symmetric if its two sides are mirror images. The normal distribution is the most well-known symmetric distribution. Asymmetry means it is skewed to one side.
- Tailedness and Peakedness (Kurtosis): Kurtosis helps us understand the nature of the tails (extreme values) and the peak of the distribution.
- Mesokurtic: Distributions with kurtosis similar to the normal distribution.
- Leptokurtic: Distributions with higher kurtosis than the normal distribution, meaning they have heavier tails (more outliers) and a sharper peak.
- Platykurtic: Distributions with lower kurtosis than the normal distribution, meaning they have lighter tails (fewer outliers) and a flatter peak.
Together, central tendency, variation, and shape measures provide a comprehensive summary of a dataset.
Important Questions from Miscellaneous
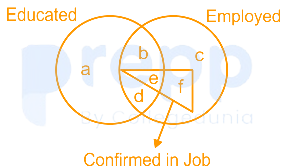
Read the given figure and find the region representing persons who are educated and employed but not confirmed in job.
The magazine in which Mahatma Gandhi mentioned what he wanted the Constitution to do is:
Which gas shields the surface of the earth from ultraviolet radiation from the sun?
Which event is marked as an Intangible Cultural Heritage of Humanity by UNESCO?
Who has been conferred with the rank of the Commander of the Order of the British Empire in 2018?


