
Understanding Nucleation Rate vs. Undercooling
This question asks to identify the correct schematic showing how the nucleation rate ($I$) of solid from a pure liquid metal varies with undercooling ($\Delta T$). Undercooling is defined as $\Delta T = T_m - T$, where $T_m$ is the melting point and $T$ is the liquid temperature.
Nucleation Rate Theory
The nucleation rate ($I$) is influenced by two competing factors related to undercooling:
- Driving Force: Increasing undercooling ($\Delta T$) provides a greater thermodynamic driving force for the formation of a new solid phase, which tends to increase the nucleation rate.
- Atomic Mobility: As undercooling increases, the liquid becomes more viscous, and atomic mobility decreases. Reduced mobility makes it harder for atoms to diffuse and arrange into stable nuclei, which tends to decrease the nucleation rate.
Behavior Analysis
Considering these factors:
- At zero undercooling ($\Delta T = 0$), the driving force is zero, so the nucleation rate ($I$) is zero.
- As undercooling increases from zero, the effect of the driving force dominates, causing the nucleation rate to increase.
- At very large undercoolings, the decrease in atomic mobility becomes significant, causing the nucleation rate to decrease.
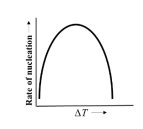
This relationship results in a curve where the nucleation rate starts at zero, rises to a maximum at an intermediate undercooling value, and then falls off at higher undercoolings.
Identifying the Correct Schematic
The schematic that accurately represents this behavior is one where the nucleation rate is zero at zero undercooling, increases to a peak, and then decreases. This is shown in the image associated with Option A.
Correct Schematic:
This curve correctly illustrates the nucleation rate starting from zero, peaking at a moderate undercooling, and declining thereafter.
Important Questions from Solidification Cooling Curve Analysis
- Critical value of the Gibbs energy of nucleation at equilibrium temperature is
- During the solidification of a pure metal, it was found that dendrites are formed. Assuming that the liquid-solid interface is at the melting temperature, the temperature from the interface into the liquid
A given volume of liquid is undercooled just below the melting temperature to form a spherical solid nucleus (consider homogeneous nucleation). The Gibbs free energy of solidification ($\Delta G_v$) is ($- 0.5 \times 10^8$) J/m$^3$. The solid-liquid interfacial energy ($\gamma$) is isotropic and its value is 0.1 J/m$^2$.
The critical nucleus size for a stable nucleus is __________ nm (answer in integer).
During solidification of a pure metal, the radius of critical nucleus at an undercooling of 10 K is ________ $\times 10^{-9} \text{ m}$ (answer rounded off to 1 decimal place).
Given: solid/liquid interface energy = $0.177 \text{ J} \cdot \text{m}^{-2}$,
melting point of the metal = 1356 K and
latent heat of fusion = $1.88 \times 10^9 \text{ J} \cdot \text{m}^{-3}$Consider homogeneous nucleation of a spherical solid in liquid. For a given undercooling, if surface energy of a nucleus increases by $20\%$, the corresponding increase (in percent) in the critical radius of the nucleus is: ___________(round off to nearest integer).


