
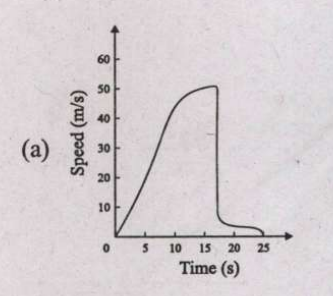
The question asks us to identify the correct diagram representing the motion of a skydiver during a jump.
Understanding Skydiver Motion Physics
When a skydiver jumps from an aircraft, their motion can be broken down into stages based on the forces acting on them:
- Initial Freefall: Immediately after jumping, the primary force is gravity (\(F_g = mg\)), pulling the skydiver downwards. Air resistance (\(F_d\)) is initially negligible. The skydiver accelerates downwards with an acceleration close to g (acceleration due to gravity, approximately \(9.8 \, \text{m/s}^2\)).
- Increasing Air Resistance: As the skydiver's velocity increases, the force of air resistance, which opposes motion and increases with velocity, also increases.
- Terminal Velocity: The net downward force (\(F_{net} = F_g - F_d\)) decreases as \(F_d\) increases. Consequently, the downward acceleration decreases. Eventually, the air resistance force becomes equal in magnitude to the gravitational force (\(F_d = F_g\)). At this point, the net force is zero (\(F_{net} = 0\)), and the skydiver stops accelerating. They continue to fall at a constant maximum velocity, known as terminal velocity (\(v_t\)).
Therefore, the skydiver's velocity-time graph should show velocity increasing initially (with decreasing acceleration) and then becoming constant.
Analyzing the Motion Diagrams (Graphs)
Let's assume the diagrams represent velocity (v) on the y-axis versus time (t) on the x-axis.
- Diagram 1: This graph shows the velocity starting from zero (or some initial value), increasing rapidly at first, and then the rate of increase slows down until the velocity becomes constant (a horizontal line). This accurately depicts the phases of acceleration due to gravity, followed by decreasing acceleration due to air resistance, and finally reaching a constant terminal velocity.
- Diagram 2: This graph shows velocity increasing linearly with time. This represents constant acceleration (\(a = \frac{\Delta v}{\Delta t} = \text{constant}\)). This is only true for the very initial part of the skydiver's fall, not the entire motion.
- Diagram 3: This graph shows velocity decreasing linearly with time, implying constant deceleration. This does not represent a skydiver's motion after jumping.
- Diagram 4: This graph shows velocity increasing and then decreasing. This pattern might represent motion with changing acceleration but doesn't fit the typical skydiver scenario, especially the decreasing velocity phase unless other forces or actions (like deploying a parachute) are involved, which isn't implied.
Conclusion on Skydiver Motion
Based on the physics of freefall and air resistance, the velocity of a skydiver increases, but the rate of increase slows down until a constant terminal velocity is reached. Diagram 1 is the only graph that correctly illustrates this pattern of motion.
The image provided for the correct answer is:
This graph shows velocity increasing and eventually leveling off, confirming it represents the skydiver's motion correctly.
Similar Questions
A vehicle starts moving along a straight line path from rest. In first t seconds it moves with an acceleration of \(2 \ m/s^2\) and then in next 10 seconds it moves with an acceleration of \(5 \ m/s^2\). The total distance travelled by the vehicle is 550 m. The value of time t is
Starting from rest a vehicle accelerates at the rate of \(2 \ m/s^2\) towards east for 10 s. It then stops suddenly. It then accelerates again at a rate of \(4\sqrt{2} \ m/s^2\) for next 10 s towards south and then again comes to rest. The net displacement of the vehicle from the starting point is
Which one of the following equations related to the motion of an object is NOT correct? (Symbols carry their usual meanings)
Important Questions from Motion
An object is covering distance in direct proportion to the square of time elapsed. What conclusion can be drawn about the motion of the object?
If the distance time graph of the motion of an object is a straight line but not parallel to the time axis, then it may be concluded that the object is moving with a:
Which of the following changes when a body performs uniform circular motion?
Vehicles have treaded tires so that it_______.
What is the formula for momentum?



