Which of the following Venn diagrams correctly represents the relationships among the classes: Educated, Mothers, Employed
Understanding Venn Diagrams for Set Relationships
A Venn diagram is a visual tool used to show the relationships between different sets or groups of things. Each set is typically represented by a circle, and the way the circles overlap (or don't overlap) shows how the sets relate to each other.
Analyzing the Categories: Educated, Mothers, Employed
We are given three categories or classes: Educated, Mothers, and Employed. Let's think about the possible relationships between these groups:
- Can a person be Educated and also a Mother? Yes, it is possible for mothers to be educated, and for educated people to be mothers. This indicates an overlap between the 'Educated' set and the 'Mothers' set.
- Can a person be Educated and also Employed? Yes, it is possible for employed people to be educated, and for educated people to be employed. This indicates an overlap between the 'Educated' set and the 'Employed' set.
- Can a person be a Mother and also Employed? Yes, many mothers are employed, and many employed people are mothers. This indicates an overlap between the 'Mothers' set and the 'Employed' set.
- Can a person be Educated, a Mother, and Employed all at the same time? Yes, it is possible for a person to be a mother who is educated and also employed. This indicates a common overlap region where all three sets intersect.
- Are all Educated people Mothers? No.
- Are all Mothers Employed? No.
- Are all Employed people Educated? No.
Since there are possibilities for overlap between any two categories, and also for overlap among all three categories, none of the sets are completely separate, and none are completely contained within another.
Determining the Correct Venn Diagram Representation
Based on our analysis, the relationships between Educated, Mothers, and Employed can be summarized as follows:
- Some Educated people are Mothers.
- Some Educated people are Employed.
- Some Mothers are Employed.
- Some people are Educated, Mothers, and Employed.
- There are also people who are only Educated, only Mothers, or only Employed.
- There are people who are Educated and Mothers but not Employed, Educated and Employed but not Mothers, and Mothers and Employed but not Educated.
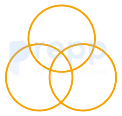
A Venn diagram that correctly represents these possibilities must show three intersecting circles. Each pair of circles should overlap to represent individuals who belong to two categories, and there must be a central region where all three circles overlap to represent individuals who belong to all three categories.
Hence is the correct answer.
Revision Table: Key Concepts
| Concept | Explanation | Relevance to Problem |
|---|---|---|
| Venn Diagram | Visual representation of relationships between sets. | Tool used to depict the relationships between Educated, Mothers, Employed. |
| Set Overlap | Region where elements belong to more than one set. | Essential for showing that some people are Educated and Mothers, etc. |
| Triple Intersection | Region where elements belong to all three sets. | Shows individuals who are Educated AND Mothers AND Employed. |
Additional Information: More on Venn Diagrams
Venn diagrams are widely used in set theory, logic, statistics, and probability. They help in visualizing complex relationships and solving problems involving multiple groups. For three sets A, B, and C, a standard Venn diagram divides the universal set into 8 distinct regions:
- A only
- B only
- C only
- A and B only
- A and C only
- B and C only
- A, B, and C
- Neither A, B, nor C
Understanding how to interpret these regions is key to solving problems involving classification based on multiple attributes, like being Educated, being a Mother, or being Employed.
Important Questions from Logical Venn Diagram
Select the Venn diagram that best illustrates the relationship among the following classes.
Neptune, Planet, Moon
Teacher, College, Student –
Cabinet, Home Minister, Minister –
Professor, Researcher, Scientist –
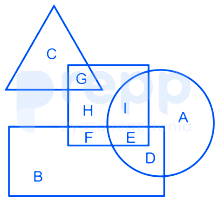
In the following figure, square represents Teachers, triangle represents swimmers, circle represents Nurses and rectangle represents Women. Which set of letters represent Teachers who are either swimmers or nurses?