
Vertebrate Population Size & Generation Time Relationship
In vertebrates, there is generally an inverse relationship observed between population size and generation time. Species with shorter generation times often have higher reproductive rates, potentially leading to larger population sizes or faster recovery. Conversely, species with longer generation times tend to have lower reproductive rates and may sustain smaller populations.
This pattern reflects life history trade-offs common in biology.
Analyzing Expected Plot Trends
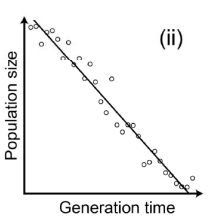
The expected plot should illustrate this inverse relationship, showing population size decreasing as generation time increases. Let's analyze the trends presented:
- Plot 1 & 2: Show a negative correlation. Population size decreases as generation time increases.
- Plot 3: Shows a positive correlation. Population size increases as generation time increases.
- Plot 4: Shows no clear correlation.
Based on general ecological and demographic principles for vertebrates, a negative correlation is the most expected relationship.
Option B, which corresponds to the second image provided in the question, displays this characteristic negative trend. As generation time on the x-axis increases, the population size on the y-axis generally decreases.
Important Questions from Population characteristics
- The field of allometry assesses how species traits scale with each other. Given the relationship between metabolic rate and body mass, which one of the following statements is true?
- What is the relationship between effective population size ($N_e$) and total population size ($N$) of any naturally occurring eukaryotic population?
- Consider the following strains of an influenza virus and their basic reproduction numbers ($R_0$). Assuming that they are all equally virulent, which one of the following strains would be most concerning for a completely vulnerable population of humans?
- Which one of the following sets of characteristics is most likely to cause population extinction via demographic stochasticity?
- The effective population size of a sexually reproducing, diploid, animal species will be highest when the sex ratio (number of reproducing males / number of reproducing females) is


