This section provides a detailed analysis of the Venn diagram options to represent the relationship between 'Beverages', 'Coffee', and 'Soft (Cold) drinks'.
Beverages Coffee Soft Drinks Category Definitions
Understanding the terms is crucial for correctly mapping their relationships:
Beverages: This is the overarching category encompassing all liquids intended for drinking.
Coffee: A specific popular beverage made from roasted coffee beans, often served hot but also available cold (e.g., iced coffee).
Soft (Cold) drinks: This category includes non-alcoholic beverages, typically carbonated or flavored, usually served cold. Examples include sodas, juices, and iced teas.
Beverages Coffee Soft Drinks Relationship Logic
In set theory and logic:
Both Coffee and Soft Drinks are specific types of Beverages. This means they are subsets of the 'Beverages' category.
Typically, Coffee and Soft Drinks are considered distinct categories from each other. While variations exist (like iced coffee), they are fundamentally different types of drinks. Therefore, their sets are usually considered disjoint (non-overlapping).
The expected Venn diagram structure based on this logic is a large circle for 'Beverages' containing two smaller, separate circles for 'Coffee' and 'Soft Drinks'.
Venn Diagram Options Evaluation
We assess how each provided option illustrates these relationships:
Option 1:
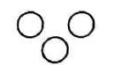
This diagram displays three entirely separate circles. It implies that 'Beverages', 'Coffee', and 'Soft Drinks' are unrelated and non-overlapping categories.
Option 2:
This shows one category contained within another, while a third category is external. This doesn't correctly map all relationships simultaneously.
Option 3:
This represents an overlap between two categories and the third being distinct, which doesn't align with the definitions of beverages.
Option 4:
This diagram shows a partial inclusion and overlap, which is also not the correct representation for these categories.
Beverages Coffee Soft Drinks Diagram Solution
The provided correct answer indicates that Option 1 is the intended representation. Although this diagram (three separate circles) contradicts the typical set relationship where Coffee and Soft Drinks are subsets of Beverages, we select it as per the given information. This suggests the question might be interpreted as listing distinct types of drinks rather than showing hierarchical set inclusion.
Therefore, the diagram featuring three separate circles corresponds to the designated correct answer.
Was this answer helpful?
Important Questions from Venn Diagram (Notes)
Which of the following diagram indicates the best relationship between German, French, Languages?
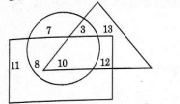
If triangle represents Men, rectangle represents Businessmen and circle represents Millionaires, then which number represents Men that are both Businessmen and Millionaires ?