
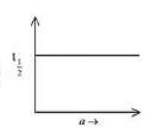
Which of the following curves represent a first order reaction?
Understanding First Order Reaction Kinetics
A first order reaction is a reaction whose rate depends on the concentration of only one reactant raised to the power of one. The rate law for a first order reaction involving a reactant A is given by:
\begin{equation*} \text{Rate} = k[A] \end{equation*}
where $[A]$ is the concentration of reactant A and $k$ is the rate constant.
Integrated Rate Law for First Order Reactions
To understand how concentration changes with time in a first order reaction, we look at the integrated rate law. The differential rate law is $\frac{d[A]}{dt} = -k[A]$. Integrating this gives:
\begin{equation*} \ln[A]_t - \ln[A]_0 = -kt \end{equation*}
Rearranging this equation, we get:
\begin{equation*} \ln[A]_t = -kt + \ln[A]_0 \end{equation*}
This equation is in the form of a straight line, $y = mx + c$, where:
- $y = \ln[A]_t$ (natural logarithm of the concentration of A at time $t$)
- $m = -k$ (the slope, which is a negative constant)
- $x = t$ (time)
- $c = \ln[A]_0$ (the y-intercept, natural logarithm of the initial concentration of A)
Therefore, plotting $\ln[A]_t$ against time $(t)$ for a first order reaction yields a straight line with a negative slope.
Analyzing the Given Reaction Curves
Let's examine the types of curves typically associated with different reaction orders when plotted in specific ways:
- Zero Order Reaction: $[A]_t = -kt + [A]_0$. A plot of $[A]_t$ versus $t$ is a straight line with a negative slope.
- First Order Reaction: $\ln[A]_t = -kt + \ln[A]_0$. A plot of $\ln[A]_t$ versus $t$ is a straight line with a negative slope.
- Second Order Reaction (Type 1: Rate = k[A]2): $\frac{1}{[A]_t} = kt + \frac{1}{[A]_0}$. A plot of $\frac{1}{[A]_t}$ versus $t$ is a straight line with a positive slope.
We are looking for a curve that represents a first order reaction. Based on the integrated rate law, the characteristic linear plot for a first order reaction is $\ln[A]_t$ vs. $t$. Let's consider the shapes of the curves provided as options:
Option 1: Shows a linear relationship, possibly Rate vs. Concentration, which could be first order (Rate = k[A]). However, the question asks for curves representing the reaction itself, usually concentration or a function of concentration vs. time.
Option 2: Shows a curve increasing with time. This could represent the concentration of a product over time, but the shape is not typically linear or a simple exponential for product formation in a standard plot type.
Option 3: Shows a curve decreasing with time in a non-linear fashion. This could represent the concentration of a reactant decaying over time for a first or second-order reaction, but neither gives a straight line when plotting concentration vs. time.
Option 4: Shows a straight line with a negative slope. This is characteristic of a plot where the y-axis represents $\ln[Reactant]$ and the x-axis represents time for a first order reaction, or potentially concentration vs time for a zero-order reaction. Given the context of reaction orders and common plots, a straight line often implies a specific manipulation of the concentration term (like $\ln[A]$ or $1/[A]$) plotted against time.
Comparing the options with the expected plots for different reaction orders, the straight line with a negative slope (Option 4) is the definitive representation of a first order reaction when the y-axis is $\ln[Reactant]$ and the x-axis is time.
Conclusion on First Order Reaction Curve
The curve that represents a first order reaction is the one showing a linear relationship with a negative slope when the natural logarithm of the reactant concentration is plotted against time. Among the given options, only Option 4 depicts a straight line with a negative slope, which fits this description for a first order reaction.
| Reaction Order | Integrated Rate Law Plot | Expected Graph Shape |
|---|---|---|
| Zero Order | $[A]_t$ vs. Time ($t$) | Straight line with negative slope |
| First Order | $\ln[A]_t$ vs. Time ($t$) | Straight line with negative slope |
| Second Order (Rate=k[A]2) | $\frac{1}{[A]_t}$ vs. Time ($t$) | Straight line with positive slope |
Revision Table: Key Kinetic Plots
| Plot (y vs. x) | Slope | Intercept | Reaction Order Indicated |
|---|---|---|---|
| $[A]$ vs. $t$ | $-k$ | $[A]_0$ | Zero Order |
| $\ln[A]$ vs. $t$ | $-k$ | $\ln[A]_0$ | First Order |
| $\frac{1}{[A]}$ vs. $t$ | $k$ | $\frac{1}{[A]_0}$ | Second Order |
Additional Information on First Order Reaction Kinetics
The half-life ($t_{1/2}$) of a first order reaction is independent of the initial concentration. It is given by the formula:
\begin{equation*} t_{1/2} = \frac{\ln(2)}{k} = \frac{0.693}{k} \end{equation*}
This is a unique characteristic of first order reactions and is often used to identify them. Radioactive decay is a common example of a process that follows first order kinetics.
Important Questions from Organic Compounds Containing Nitrogen
What product is obtained when chloroform reacts with oxygen in presence of light?
What is the IUPAC name of picric acid?
Which among the following halogen exists in liquid state at room temperature?
The central atoms/ions in the coordination compounds are referred as:
What is the IUPAC name of [Pt(NH3)2Cl(NO2)]?


