
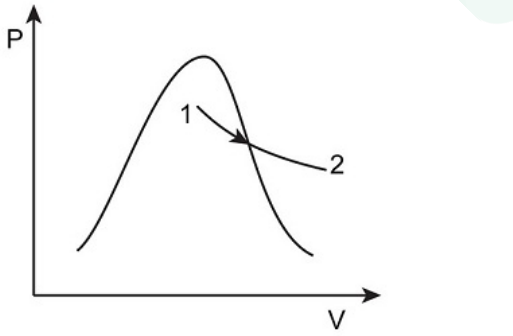
Isothermal Process Curve for Steam
The question asks to identify the correct curve representing an isothermal process where wet steam is converted into superheated steam. This analysis is typically done on a Temperature-Entropy (T-s) diagram.
Characteristics of Isothermal Process on T-s Diagram
- An isothermal process occurs at a constant temperature.
- On a T-s diagram, a constant temperature process is represented by a horizontal line.
Steam State Changes
- Wet Steam: A mixture of saturated liquid and saturated vapor.
- Saturated Steam: Steam at the point of vaporization (pure vapor).
- Superheated Steam: Steam heated beyond its saturation temperature at a given pressure.
Process Explanation
When wet steam is heated isothermally:
- Initially, heat addition causes the liquid phase to vaporize, turning the wet steam into saturated steam. This occurs at a constant saturation temperature.
- As heating continues at the same constant temperature, the saturated steam becomes superheated steam.
Therefore, on a T-s diagram, the process starts within the saturation dome (wet region), crosses the saturation line, and continues into the superheated region, all along a line of constant temperature (a horizontal line).
Identifying the Correct Curve
The correct curve must be a horizontal line starting in the saturation region (representing wet steam) and extending into the region beyond the saturation dome (representing superheated steam), indicating a constant temperature process. Option 1 correctly depicts this horizontal path.
Important Questions from Thermodynamic Properties of Steam & Steam Tables
Vaporization refers to the change in state of matter from
- The properties of water are arranged in the steam tables as a functions of
Fill in the blank with the appropriate word(s) from the options.
In a steam table, the data always refers to the properties of steam at its _________.
The critical point of water is
The amount of water evaporated from and at 100 °C into dry saturated steam at atmospheric pressure is called


