Which is the best diagram, showing the relation among Father, Mother and family.

Understanding Relations with Venn Diagrams
Venn diagrams are useful tools for visualizing the relationships between different sets or groups of things. In this question, we need to find the diagram that best shows the relationship between 'Father', 'Mother', and 'Family'.
Analyzing the Relationship: Father, Mother, and Family
- A Family is a group of people, often including parents and children.
- A Father is a male parent.
- A Mother is a female parent.
- Both Father and Mother are members of a Family.
- A Father is distinct from a Mother; they are different roles/people.
So, the set of 'Fathers' and the set of 'Mothers' are distinct groups that are contained within the larger set of 'Family'.
Evaluating the Venn Diagram Options
Let's look at the provided options and see which one correctly represents this relationship:
Option 1: This diagram shows three circles. A large circle likely represents 'Family', and two smaller circles inside overlap. If the smaller circles are 'Father' and 'Mother', the overlap implies that some individuals are both Father and Mother, which is incorrect.
Option 2: This diagram shows three separate circles with no overlap and no containment. This would mean Father, Mother, and Family are entirely separate entities, which is clearly wrong as Father and Mother are part of a Family.
Option 3: This diagram shows one circle inside another, and a third circle separate from both. This could represent one group being a subset of another, with a third unrelated group. This does not fit the relationship of Father, Mother, and Family where both Father and Mother are subsets of Family, but are distinct from each other.
Option 4: This diagram shows a large circle representing 'Family', and two smaller, distinct circles completely contained within the large circle. These two smaller circles do not overlap. This correctly represents 'Fathers' as a group within 'Family', 'Mothers' as a group within 'Family', and shows that the group of Fathers and the group of Mothers are distinct (they don't overlap).
Conclusion: Best Diagram for Family Relation
Based on our analysis of the relationships, the diagram in Option 4 accurately depicts Father and Mother as separate categories contained within the overarching category of Family.
Revision Table: Venn Diagram Relations
| Diagram Type | Relationship Shown | Example |
|---|---|---|
| Two separate circles | Mutually exclusive sets (no elements in common) | <p>Boys, Girls</p> |
| Two overlapping circles | Sets with some common elements | <p>Students, Athletes</p> |
| One circle inside another | Subset (all elements of the smaller set are in the larger set) | <p>Dogs, Mammals</p> |
| Two separate circles inside a larger circle | Two distinct subsets within a larger set | <p>Fathers, Mothers, Family</p> |
Additional Information: Understanding Venn Diagrams
Venn diagrams are named after mathematician John Venn. They use circles (or other shapes) to show the logical relationships between sets. The area within a shape represents the elements belonging to that set. Overlapping areas represent elements common to both sets (the intersection). Areas outside the shapes represent elements not in those sets.
- They are widely used in mathematics, logic, statistics, and computer science.
- They help to visually represent set operations like union, intersection, and complement.
- Solving logic problems often involves translating verbal statements into Venn diagrams to see the relationships clearly.
Important Questions from Logical Venn Diagram
Select the Venn diagram that best illustrates the relationship among the following classes.
Neptune, Planet, Moon
Teacher, College, Student –
Cabinet, Home Minister, Minister –
Professor, Researcher, Scientist –
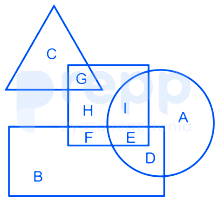
In the following figure, square represents Teachers, triangle represents swimmers, circle represents Nurses and rectangle represents Women. Which set of letters represent Teachers who are either swimmers or nurses?