
Which diagram shows churning poor?
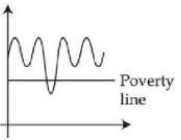
Identifying Churning Poor in Poverty Diagrams
Understanding poverty dynamics helps us see how people move in and out of poverty over time. The term "churning poor" refers to individuals or households that frequently transition into and out of poverty. They are not always poor (like the chronically poor) but face instability and vulnerability, falling below the poverty line periodically.
Diagrams showing poverty dynamics often illustrate different states people can be in, such as:
- Non-poor: Always above the poverty line.
- Transient poor: Move in and out of poverty. This group represents the "churning poor."
- Chronic poor: Remain below the poverty line for a long time or permanently.
The diagrams provided likely show movements or transitions between these states over time. We need to identify the diagram that best illustrates significant movement between the non-poor state and the poor state, which is characteristic of churning poverty.
Analyzing Poverty Dynamics Diagrams
Let's examine what each diagram might represent based on typical depictions of poverty dynamics:
Diagram 1: <figure class="image"><img data-src-id="67a08611bfd0b0c64d0cabbd"></figure>
- This diagram might show a different type of poverty distribution or perhaps lack clear transitions between non-poor and poor states in a way that highlights churning. Without labels, it's hard to be certain, but it doesn't visually emphasize back-and-forth movement.
Diagram 2: <figure class="image"><img data-src-id="67a0862042e06e83ecb62707"></figure>
- This diagram might represent a stable non-poor population, or perhaps chronic poverty with little movement out. It doesn't seem to depict frequent transitions in and out of poverty.
Diagram 3: <figure class="image"><img data-src-id="67a0863242e06e83ecb62f15"></figure>
- This diagram shows significant back-and-forth arrows or movements between different states, likely representing non-poor and poor. The dynamic transitions illustrated here strongly suggest people are repeatedly falling into and climbing out of poverty. This pattern is characteristic of churning poverty, or the transient poor.
Diagram 4: <figure class="image"><img data-src-id="67a0863e1dfa366d2079cf2e"></figure>
- This diagram might show chronic poverty or possibly movement into poverty without much exit. It doesn't exhibit the frequent bidirectional flow between states seen in the churning poor representation.
Conclusion: Identifying Churning Poor Diagram
Based on the analysis of how different poverty states and transitions are typically represented, the diagram that visually depicts significant movement back and forth between non-poor and poor states is the one representing churning poor (transient poor). Diagram 3 shows this dynamic movement most clearly.
| Poverty Category | Description | Movement |
|---|---|---|
| Non-poor | Always above poverty line | Stays above poverty line |
| Transient Poor (Churning Poor) | Moves in and out of poverty | Transitions between non-poor and poor states |
| Chronic Poor | Always below poverty line | Stays below poverty line |
Revision Table: Poverty Dynamics Terms
| Term | Meaning in Poverty Studies |
|---|---|
| Poverty Line | Minimum income required to meet basic needs. |
| Poverty Dynamics | How people's poverty status changes over time. |
| Transient Poverty | Experiencing poverty for short, intermittent periods. |
| Chronic Poverty | Experiencing poverty for a long time or permanently. |
| Vulnerability | The risk of falling into poverty due to shocks or stresses. |
Additional Information: Transient vs. Chronic Poverty
It's important to distinguish between transient and chronic poverty when studying poverty dynamics. While both groups are poor at some point, their experiences and the causes of their poverty can differ significantly. Transient poverty is often linked to temporary shocks like illness, job loss, or natural disasters, or seasonal fluctuations in income. People in transient poverty may have some assets or support networks that allow them to escape poverty when the shock passes or conditions improve. Churning poor face uncertainty and instability. Chronic poverty, on the other hand, is often associated with deeper, structural issues such as lack of education, poor health, discrimination, geographic isolation, or limited access to resources and opportunities. Escaping chronic poverty typically requires more sustained and fundamental interventions.
Important Questions from Demand
50 units of good X is demanded at a price of 10 per unit. When price changes the quantity demanded rises by 20 units. Calculate the new price of good X. The coefficient of elasticity of demand as unity.
Arrange the exchange rate system prevailed according to chronological order:
(A) The Bretton Wood System
(B) Currency Board
(C) Special Drawing Rights
(D) The Gold Standard
(E) European Monetary Union
Choose the correct answer from the options given below:
Match List-I with List-II:
List-I List-II (A) Capital Expenditure (I) Borrowing (B) Revenue Expenditure (II) Escheats (C) Revenue Receipts (III) Subsidies (D) Fiscal Deficit (IV) Repayment of Foreign Debts Choose the correct answer from the options given below:
Different individuals can get different satisfaction levels from the same commodity. A consumer usually decides his demand based on ________ that consumer derives from it.
What is the correct order of price elasticity of demand moving upward on a straight line negatively sloped demand curve?
(A) ep = 0 when price is 0
(B) ep > 1
(C) ep < 1
(D) ep = 1
(E) ep = ∞
Choose the correct answer from the options given below:


