
Consider the following table which contain number of blood samples given in bracket collected by a hospital to identify blood group in a particular month. Based on the data in the table answer question. Hospital Hospital Hospital Hospital Hospital Reported Blood group W X Y Z (1000) (500) (1000) (500) A Positive 300 150 350 100 B Positive 350 100 300 100 A Negative 150 50 150 50 B Negative 100 50 50 150
What is the ratio of A-positive cases to A-Negative cases?
9 : 4
Analyzing Hospital Blood Sample Data
The question asks us to determine the ratio of A-positive cases to A-negative cases based on the data provided in the table about blood samples collected by four hospitals (W, X, Y, Z) in a particular month.
| Hospital | Reported Blood group | W (1000) | X (500) | Y (1000) | Z (500) |
|---|---|---|---|---|---|
| Hospital | A Positive | 300 | 150 | 350 | 100 |
| Hospital | B Positive | 350 | 100 | 300 | 100 |
| Hospital | A Negative | 150 | 50 | 150 | 50 |
| Hospital | B Negative | 100 | 50 | 50 | 150 |
To find the required ratio, we first need to calculate the total number of A-positive cases and the total number of A-negative cases reported by all four hospitals combined.
Calculating Total A Positive Cases
The total number of A Positive cases is the sum of A Positive cases from each hospital:
- Hospital W: 300
- Hospital X: 150
- Hospital Y: 350
- Hospital Z: 100
Total A Positive cases $= 300 + 150 + 350 + 100 = 900$.
Using LaTeX:
\( \text{Total A Positive} = 300 + 150 + 350 + 100 = 900 \)
Calculating Total A Negative Cases
Similarly, the total number of A Negative cases is the sum of A Negative cases from each hospital:
- Hospital W: 150
- Hospital X: 50
- Hospital Y: 150
- Hospital Z: 50
Total A Negative cases $= 150 + 50 + 150 + 50 = 400$.
Using LaTeX:
\( \text{Total A Negative} = 150 + 50 + 150 + 50 = 400 \)
Determining the Ratio of A Positive to A Negative Cases
The ratio of A-positive cases to A-negative cases is the total number of A Positive cases divided by the total number of A Negative cases.
Ratio = Total A Positive Cases : Total A Negative Cases
Ratio = 900 : 400
To simplify the ratio, we can divide both numbers by their greatest common divisor. Both 900 and 400 are divisible by 100.
\( \frac{900}{100} : \frac{400}{100} \)
\( 9 : 4 \)
So, the ratio of A-positive cases to A-negative cases is 9 : 4.
Ratio of A-positive to A-Negative Blood Cases
Based on our calculations from the hospital blood sample data, the total A-positive cases are 900 and the total A-negative cases are 400. The ratio is found by simplifying 900:400.
Steps to simplify the ratio:
- Start with the ratio 900 : 400.
- Divide both numbers by a common factor, for example, 100.
- \( 900 \div 100 = 9 \)
- \( 400 \div 100 = 4 \)
- The simplified ratio is 9 : 4.
Therefore, the ratio of A-positive cases to A-negative cases is 9 : 4.
Revision Table: Hospital Blood Group Data Analysis
| Blood Group | Total Cases (Across W, X, Y, Z) |
|---|---|
| A Positive | \(300 + 150 + 350 + 100 = 900\) |
| A Negative | \(150 + 50 + 150 + 50 = 400\) |
| Ratio (A Positive : A Negative) | \(900 : 400\) or \(9 : 4\) |
Additional Information: Understanding Blood Groups and Ratios
Blood groups are determined by the presence or absence of certain antigens on the surface of red blood cells. The ABO blood group system classifies blood into four main types: A, B, AB, and O. The Rh factor adds another classification: positive (+) or negative (-).
Ratios are used to compare two quantities. In this case, we are comparing the number of A-positive cases to the number of A-negative cases. A ratio of 9:4 means that for every 9 A-positive cases, there are 4 A-negative cases.
Understanding ratios is important in many fields, including healthcare, for analyzing data trends, patient demographics, and resource allocation based on specific needs like blood transfusions.
Important Questions from Data Interpretation
The table given below shows the earnings of two persons on five different days.
What is the ratio of total earnings of P to the total earnings of Q?Earnings Days P Q Monday 105 150 Tuesday 96 110 Wednesday 65 122 Thursday 115 106 Friday 130 68 The table below shows the number of toys of 6 different colours sold from a shop during a given period. The table also shows the percentage of toys of each colour which are cars.
Colour Total toys Percentage of cars C1 500 12 C2 600 15 C3 400 12.5 C4 550 10 C5 650 20 C6 450 10 What is the total number of car toys of C2 and C3 taken together?
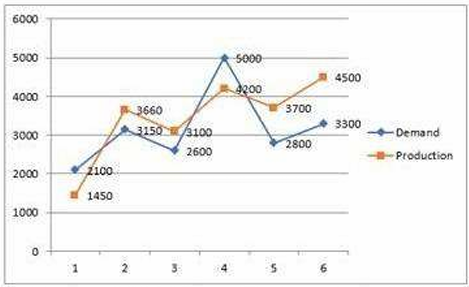
Study the given graph carefully and answer the question that follows. The graph shows the demand and production of different companies.
The ratio between the companies having more production than demand and more demand than production is:
Study the given table and answer the question that follows. The given table shows the number of new employees added to different categories of employees in a company for four years and the number of employees from these categories who left the company every year.
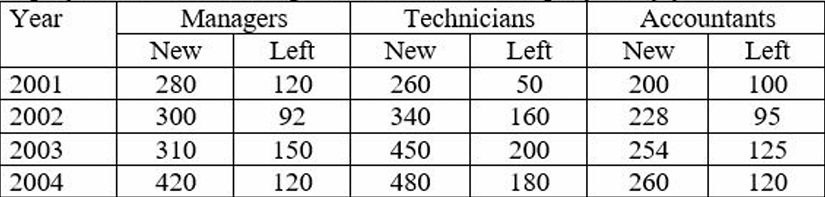
During the period between 2001 and 2004, the total number of Technicians who left the Company is what percentage (rounded off to the nearest integer) of the total number of Technicians who joined the Company?
The given pie-chart shows the percentage distribution of 20,000 employees in a company. Study the given chart and answer the question that follows. If 30% of the employees in department D are females, then how many male employees are there in that department?


