
Consider the following table which contain number of blood samples given in bracket collected by a hospital to identify blood group in a particular month. Based on the data in the table answer question. Hospital Hospital Hospital Hospital Hospital Reported Blood group W X Y Z (1000) (500) (1000) (500) A Positive 300 150 350 100 B Positive 350 100 300 100 A Negative 150 50 150 50 B Negative 100 50 50 150
What is the percentage of blood group reported in the table?
83.33
Analyzing Blood Sample Data and Percentage Calculation
The question asks for the percentage of blood groups reported based on the data provided in the table. The table gives information about the number of blood samples collected by four different hospitals (W, X, Y, Z) and how many of these samples were reported for specific blood groups (A Positive, B Positive, A Negative, B Negative).
Understanding the Given Data
The table provides the total number of samples collected by each hospital in brackets next to the hospital name. It also lists the number of samples reported for each blood group category under each hospital.
| Hospital | Total Samples Collected | A Positive | B Positive | A Negative | B Negative |
|---|---|---|---|---|---|
| W | 1000 | 300 | 350 | 150 | 100 |
| X | 500 | 150 | 100 | 50 | 50 |
| Y | 1000 | 350 | 300 | 150 | 50 |
| Z | 500 | 100 | 100 | 50 | 150 |
Calculating Total Samples Collected
First, we need to find the total number of blood samples collected by all four hospitals combined. This is given by the numbers in brackets:
Total Collected Samples = Samples by W + Samples by X + Samples by Y + Samples by Z
Total Collected Samples = $1000 + 500 + 1000 + 500 = 3000$
Calculating Total Reported Blood Samples
Next, we need to find the total number of samples for which the blood group was reported. This is the sum of all the numbers in the columns for A Positive, B Positive, A Negative, and B Negative, across all hospitals.
Total Reported Samples = (A Positive by W+X+Y+Z) + (B Positive by W+X+Y+Z) + (A Negative by W+X+Y+Z) + (B Negative by W+X+Y+Z)
- Total A Positive reported: $300 + 150 + 350 + 100 = 900$
- Total B Positive reported: $350 + 100 + 300 + 100 = 850$
- Total A Negative reported: $150 + 50 + 150 + 50 = 400$
- Total B Negative reported: $100 + 50 + 50 + 150 = 350$
Total Reported Samples = $900 + 850 + 400 + 350 = 2500$
Calculating the Percentage of Blood Group Reported
The percentage of blood group reported is calculated by dividing the total reported samples by the total collected samples and multiplying by 100.
Percentage Reported = $\left( \frac{\text{Total Reported Samples}}{\text{Total Collected Samples}} \right) \times 100$
Percentage Reported = $\left( \frac{2500}{3000} \right) \times 100$
Percentage Reported = $\left( \frac{25}{30} \right) \times 100$
Percentage Reported = $\left( \frac{5}{6} \right) \times 100$
Percentage Reported = $0.8333... \times 100$
Percentage Reported $\approx 83.33\%$
Comparing with Options
The calculated percentage of blood group reported is approximately 83.33%. Let's compare this with the given options:
- 82.12%
- 83.33%
- 84.33%
- 84.12%
Our calculated value matches option 2.
Revision Table: Key Calculations
| Description | Calculation | Result |
|---|---|---|
| Total Samples Collected | $1000 + 500 + 1000 + 500$ | 3000 |
| Total A Positive Reported | $300 + 150 + 350 + 100$ | 900 |
| Total B Positive Reported | $350 + 100 + 300 + 100$ | 850 |
| Total A Negative Reported | $150 + 50 + 150 + 50$ | 400 |
| Total B Negative Reported | $100 + 50 + 50 + 150$ | 350 |
| Total Reported Samples | $900 + 850 + 400 + 350$ | 2500 |
| Percentage Reported | $\left( \frac{2500}{3000} \right) \times 100$ | $\approx 83.33\%$ |
Additional Information: Data Analysis Basics
Data analysis often involves calculating percentages and proportions to understand trends and relationships within the data. In this case, we analyzed hospital blood sample data to find the proportion of collected samples that had their blood group successfully reported.
- Total vs. Reported: It's important to distinguish between the total number of items collected or surveyed and the number of items for which specific data points were recorded or reported. The percentage calculation shows the completeness or coverage of the reported data relative to the total.
- Percentage Formula: The general formula for percentage is $\left( \frac{\text{Part}}{\text{Whole}} \right) \times 100$. In this problem, the 'Part' is the total reported blood samples, and the 'Whole' is the total collected samples.
- Data Interpretation: A higher percentage of reported data generally indicates better data collection completeness. A lower percentage might suggest issues in the collection or reporting process for some samples.
Important Questions from Data Interpretation
The table given below shows the earnings of two persons on five different days.
What is the ratio of total earnings of P to the total earnings of Q?Earnings Days P Q Monday 105 150 Tuesday 96 110 Wednesday 65 122 Thursday 115 106 Friday 130 68 The table below shows the number of toys of 6 different colours sold from a shop during a given period. The table also shows the percentage of toys of each colour which are cars.
Colour Total toys Percentage of cars C1 500 12 C2 600 15 C3 400 12.5 C4 550 10 C5 650 20 C6 450 10 What is the total number of car toys of C2 and C3 taken together?
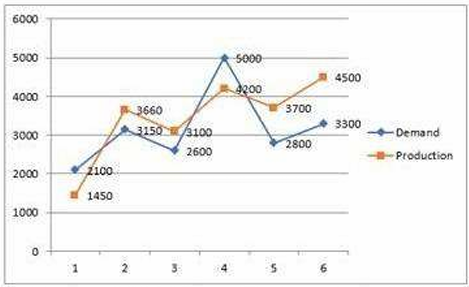
Study the given graph carefully and answer the question that follows. The graph shows the demand and production of different companies.
The ratio between the companies having more production than demand and more demand than production is:
Study the given table and answer the question that follows. The given table shows the number of new employees added to different categories of employees in a company for four years and the number of employees from these categories who left the company every year.
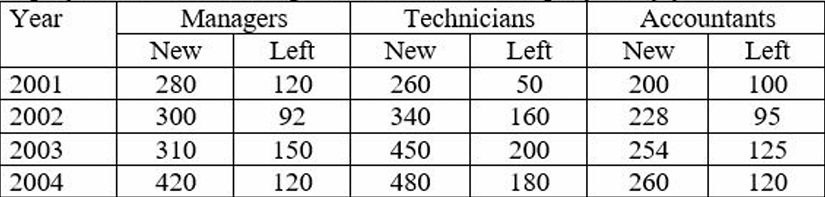
During the period between 2001 and 2004, the total number of Technicians who left the Company is what percentage (rounded off to the nearest integer) of the total number of Technicians who joined the Company?
The given pie-chart shows the percentage distribution of 20,000 employees in a company. Study the given chart and answer the question that follows. If 30% of the employees in department D are females, then how many male employees are there in that department?


