
The pie diagram given below represents the number of valid votes polled to the four candidates P, Q, R and S who were contesting for university leadership. The total number of valid votes polled were 720. Study this diagram carefully and answer the questions from 28 to 31 based on it.
The distribution of votes by angle is as follows: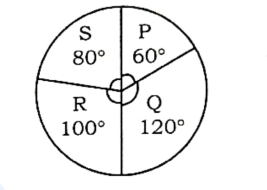
Votes Distribution Analysis from Pie Chart
This solution explains how to find the vote difference between the winning candidate and their nearest opponent using the provided pie chart data.
1. Votes Per Degree Calculation
The pie chart represents 720 total valid votes over $360^\circ$. Calculate the votes represented by each degree:
Votes per degree = $\frac{720 \text{ votes}}{360^\circ} = 2$ votes/degree
2. Candidate Votes Calculation
Determine the votes for each candidate based on their sector angle:
- P: $60^\circ \times 2 = 120$ votes
- Q: $120^\circ \times 2 = 240$ votes
- R: $100^\circ \times 2 = 200$ votes
- S: $80^\circ \times 2 = 160$ votes
Check: $120 + 240 + 200 + 160 = 720$ votes.
3. Winner and Nearest Opponent Identification
Order the candidates by votes received:
- Q: 240 votes (Winner)
- R: 200 votes (Nearest Opponent)
- S: 160 votes
- P: 120 votes
4. Vote Difference Calculation
Calculate the margin between the winner (Q) and the nearest opponent (R):
Difference = Votes(Q) - Votes(R) = $240 - 200 = 40$ votes
The winning candidate defeated their nearest opponent by 40 votes.
Important Questions from Pie Chart
The given pie-diagram shows the expenditure incurred on the preparation of a book by a publisher, under various heads. Study the pie-diagram and answer the question that follows.
Various Expenditures (in percentage) incurred in Publishing a Book
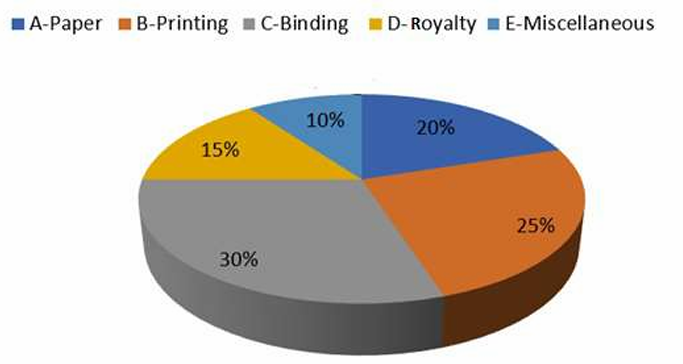
The marked price of a book is 20% more than the CP. If the marked price of the book is ₹30, then what is the cost of paper used in a single copy of the book?
Study the given pie-charts and answer the question that follows.
The pie-charts show the characteristics of foreign tourists visiting India during a given year.
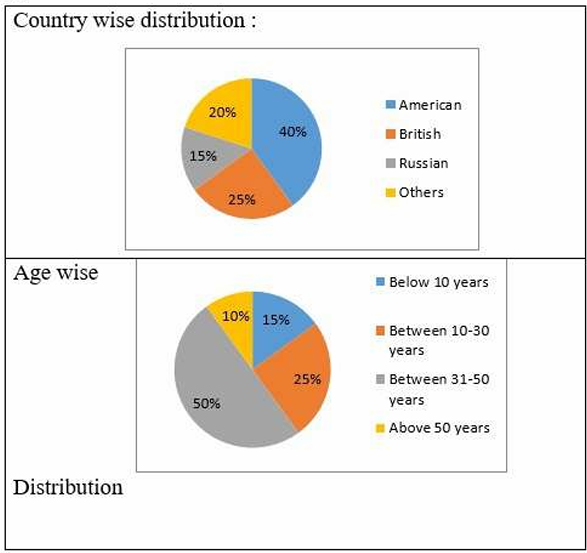
If in a given year, 2,50,000 tourists visited India and the age-wise distribution of data applies to all the countries, then the number of Russian tourists who visited India during the year and were in the age group above 50 years is:
A battery manufacturer manufactures five different types of batteries. The total revenue for the year 2020 is Rs.25,00,000, and 20,000 units were exported in 2020. The distribution of revenue and units for the five different types of batteries is shown in the charts.
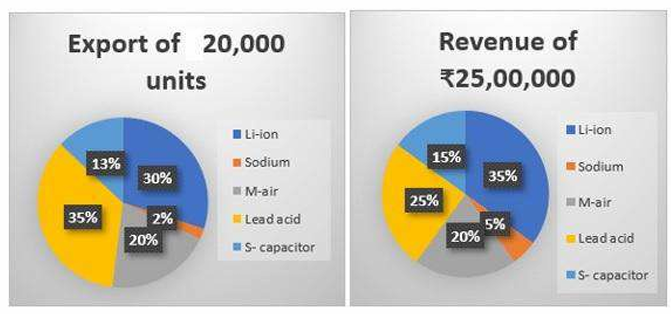
Which type of battery provides the lowest revenue per unit?
What type of chart is used to compare parts of a whole in MS-Excel?
The average of two numbers is M. If one number is N, then the other number is:


