
Directions : The following graph shows the production of cement in Million Tonnes during the various years. Study the same and answer the following questions correctly: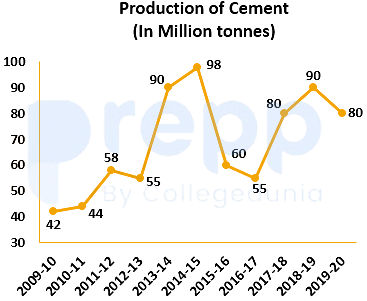
The production fell down to the maximum extent in the year:
2015-16
Calculation:
Year | Production of Cement (In MT) |
2009-10 | 42 |
2010-11 | 44 |
2011-12 | 58 |
2012-13 | 55 |
2013-14 | 90 |
2014-15 | 98 |
2015-16 | 60 |
2016-17 | 55 |
2017-18 | 80 |
2018-19 | 90 |
2019-20 | 80 |
From options:
1) For 2012-13 = 55 million tonnes
Production fell down as compare to previous year is = 58 - 55 = 3 million tonnes
2) For 2015 - 16 = 60 million tonnes
Production fell down as compare to previous year is = 98 - 60 = 38 million tonnes
3) For 2016 - 17 = 55 million tonnes
Production fell down as compare to previous year is = 60 - 55 = 5 million tonnes
4) For 2019 - 20 = 80 million tonnes
Production fell down as compare to the previous year is = 90 - 80 = 10 million tonnes
∴ From above, during the year 2015 - 16, production fell down to a maximum extent.
Important Questions from Line Graph
What is the difference between the total production of Ford and Tata motors in the given years?
What is the average number of cars manufactured by Honda over the given period?
The production of Honda in 2018 was approximately what percent of the production of Tata Motors in the same year?
What is the difference between the number of cars manufactured by Ford in the year 2018 and 2019?
What is the average of all the cars manufactured by Tata Motors and Honda in 2016 and 2019?


