
The following figure (not to the scale) shows a catchment (Q, S, U, T, Q) andadjoining raingauge stations P, Q, R, S, U and V. Due to a storm, 20 mm, 25 mm,30 mm, 15 mm, 22 mm and 18 mm rainfall depths were recorded by raingauges atP, Q, R, S, U and V, respectively. 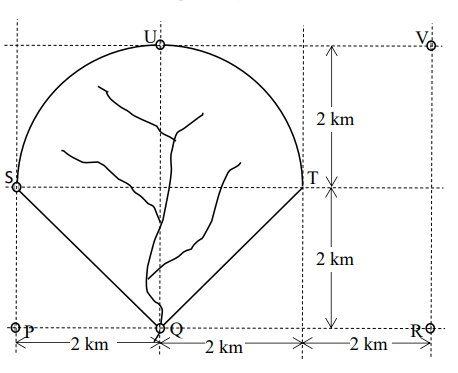
The corresponding mean rainfall over the catchment using Thiessen polygon method is ________ (in mm, rounded off to two decimal places).
1. Catchment Geometry and Total Area
To simplify calculations, let's establish a coordinate system with station Q at the origin $(0, 0)$. Based on the provided dimensions:
- Station Q: $(0, 0)$
- Station P: $(-2, 0)$
- Station R: $(4, 0)$
- Station S: $(-2, 2)$
- Station U: $(0, 4)$
- Station V: $(4, 4)$
- Point T (on boundary): $(2, 2)$
- Center of the arc C: $(0, 2)$
The catchment area consists of two parts:
- Lower Triangle (QST): Base $ST = 4 \text{ km}$, Height $= 2 \text{ km}$. $$A_{\text{tri}} = \frac{1}{2} \times 4 \times 2 = 4 \text{ km}^2$$
- Upper Semi-circle (SUT): Radius $R = 2 \text{ km}$. $$A_{\text{semi}} = \frac{1}{2} \times \pi \times 2^2 = 2\pi \approx 6.283 \text{ km}^2$$
Total Catchment Area: $$A_{\text{total}} = 4 + 2\pi \approx 10.283 \text{ km}^2$$
2. Determination of Influence Areas ($A_i$)
The Thiessen polygon method assigns an influence area to each gauge based on perpendicular bisectors between adjacent stations. Only stations Q, S, and U have influence within the catchment boundaries:
- Station Q: The bisector of $QR$ is $x = 2$, and the bisector of $QU$ is $y = 2$. Within the lower part, the bisector of $QS$ passes through $C(0,2)$ and $M(-1,1)$. The area closer to Q includes the right triangle $QCT$ (Area = 2) and the left sub-triangle $QMC$ (Area = 1). $$A_Q = 2 + 1 = 3 \text{ km}^2$$
- Station S: It influences the left part of the lower triangle above the bisector (triangle $SMC$, Area = 1) and half of the left quadrant (sector of $45^\circ$, Area = $\pi/2$). $$A_S = 1 + \frac{\pi}{2} \approx 2.571 \text{ km}^2$$
- Station U: It influences the other half of the left quadrant (Area = $\pi/2$) and the entire right quadrant $TCU$ (Area = $\pi$) because all points in $TCU$ are closer to U than to Q, R, or V. $$A_U = \frac{\pi}{2} + \pi = \frac{3\pi}{2} \approx 4.712 \text{ km}^2$$
- Stations P, R, V: Their influence areas lie entirely outside the catchment boundary ($A_P = A_R = A_V = 0$).
3. Mean Rainfall Calculation
The mean rainfall $\bar{P}$ is calculated as the weighted average:
$$ \bar{P} = \frac{\sum (P_i \times A_i)}{A_{\text{total}}} $$
Given rainfall depths: $P_Q = 25 \text{ mm}, P_S = 15 \text{ mm}, P_U = 22 \text{ mm}$.
𝑃 ˉ = 25 ( 3 ) + 15 ( 1 + 𝜋 2 ) + 22 ( 3 𝜋 2 ) 4 + 2 𝜋 P ˉ = 4+2π 25(3)+15(1+ 2 π )+22( 2 3π ) 𝑃 ˉ = 75 + 15 + 7.5 𝜋 + 33 𝜋 4 + 2 𝜋 P ˉ = 4+2π 75+15+7.5π+33π 𝑃 ˉ = 90 + 40.5 𝜋 4 + 2 𝜋 P ˉ = 4+2π 90+40.5π
Substituting $\pi \approx 3.14159$:
$$ \bar{P} \approx \frac{90 + 127.2345}{10.2832} \approx \frac{217.2345}{10.2832} \approx 21.125 $$
Final Answer:
The mean rainfall over the catchment is 21.13 mm (rounded to two decimal places).
Important Questions from Precipitation
Cumulative frequency curve that shows the percent of time specified discharge were equaled or exceeded during a given period is known as ________.
Which factors are used to compute precipitation?
Unit of runoff is
What is the formula of intensity of rainfall ?
- Mass curve of rainfall represents the plot of _______ against time.


