The following bar graph shows the production of cement (in 10,000 tones) by 4 companies X, Y, Z and W during the period 2018 - 2020. Study the bar graph carefully and answer the question. Which company has the maximum average production over the course of 3 years?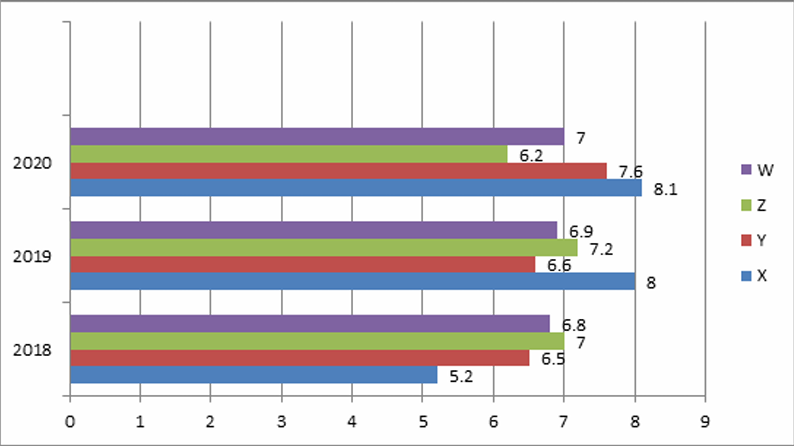
X
To find the company with the maximum average production over the course of 3 years, we calculate the average production of each company over the 3 years:
- For company X: (6.5 + 6.8 + 7) ÷ 3 = 6.77
- For company Y: (6.5 + 6.9 + 6.2) ÷ 3 = 6.53
- For company Z: (6.5 + 7.2 + 7.6) ÷ 3 = 7.1
- For company W: (7 + 8 + 7.6) ÷ 3 = 7.53
Thus, company X has the maximum average production of 7.53.
Important Questions from Mixed Data Interpretation
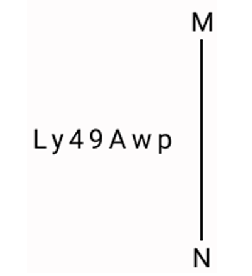
Select the correct mirror image of the given combination when the mirror is placed at MN as shown below.
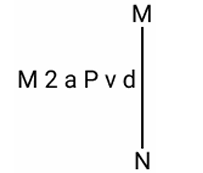
Choose the alternative which closely resembles the mirror image of the given combination.
Select the correct mirror image of the given combination when the mirror is placed at MN as shown below.
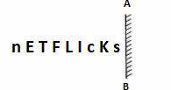
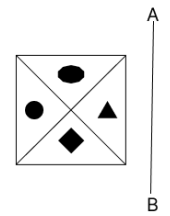
Select the correct mirror image of the given figure when the mirror is placed at AB as shown below.
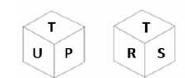
Six letters N, P, R, S, T and U are written on different faces of a dice. Two positions of this dice are shown in the figure. Which is the letter on the face opposite to the face containing U?