
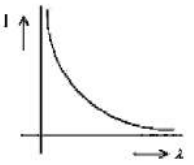
The anode voltage of a photocell is kept fixed. The wavelength of light falling on the cathode is gradually changed. The plate current \( I \) of the photocell varies as follows.
Understanding the Photocell and Photoelectric Effect
A photocell is a device that works based on the photoelectric effect. When light falls on a photosensitive surface (the cathode), it can eject electrons if the energy of the photons is high enough. These emitted electrons are called photoelectrons.
In a typical photocell circuit, there is a cathode and an anode, with a voltage applied between them. The anode is usually kept at a positive potential relative to the cathode to attract the emitted photoelectrons, creating a current in the circuit, known as the plate current or photocurrent \( I \).
Threshold Wavelength for Photoemission
The photoelectric effect only occurs if the energy of the incident light photons is greater than or equal to the work function (\( \phi_0 \)) of the cathode material. The work function is the minimum energy required to remove an electron from the surface.
The energy of a photon is given by \( E = h\nu = \frac{hc}{\lambda} \), where \( h \) is Planck's constant, \( c \) is the speed of light, \( \nu \) is the frequency, and \( \lambda \) is the wavelength of the light.
The condition for photoemission is \( \frac{hc}{\lambda} \ge \phi_0 \). This inequality can be rewritten in terms of wavelength:
\( \lambda \le \frac{hc}{\phi_0} \)
The maximum wavelength for which photoemission can occur is called the threshold wavelength (\( \lambda_0 \)):
\( \lambda_0 = \frac{hc}{\phi_0} \)
If the wavelength of the incident light is greater than the threshold wavelength (\( \lambda > \lambda_0 \)), the photons do not have enough energy to overcome the work function, and no photoelectrons are emitted. Consequently, the plate current \( I \) will be zero.
Photocell Plate Current Variation with Wavelength
The question states that the anode voltage is kept fixed and the wavelength of light falling on the cathode is gradually changed. We need to see how the plate current \( I \) varies with the wavelength \( \lambda \).
Based on the photoelectric effect:
- For \( \lambda > \lambda_0 \), where \( \lambda_0 \) is the threshold wavelength, the photon energy is too low for emission. Therefore, the plate current \( I \) is zero.
- For \( \lambda \le \lambda_0 \), photoemission occurs. The number of emitted photoelectrons per second contributes to the plate current. Assuming the intensity of light is kept constant as the wavelength is varied, the number of incident photons per second is proportional to \( \lambda \) (since Intensity is energy per unit area per unit time, and energy per photon is \(hc/\lambda\)). However, the efficiency with which photons cause electron emission (quantum efficiency) generally depends on the photon energy; it tends to increase as photon energy increases (i.e., as \( \lambda \) decreases) above the threshold.
With a fixed positive anode voltage, most of the emitted electrons are collected, and the current is proportional to the number of photoelectrons emitted per second. For wavelengths below the threshold (\( \lambda < \lambda_0 \)), as the wavelength decreases (and photon energy \(hc/\lambda\) increases), the probability of emission per photon increases, and the kinetic energy of the emitted electrons increases. These factors lead to an increase in the number of collected electrons, and hence the plate current \( I \) increases as the wavelength \( \lambda \) decreases.
Combining these points:
- The current is zero for all wavelengths greater than or equal to the threshold wavelength \( \lambda_0 \).
- For wavelengths less than \( \lambda_0 \), the current is non-zero and increases as the wavelength decreases (moving towards shorter wavelengths).
Analyzing the Graph Options
We are looking for a graph of plate current \( I \) versus wavelength \( \lambda \) that shows these characteristics.
- Graph 1 shows current decreasing from a maximum to zero as wavelength increases, and staying zero after a certain point. This matches the expected behavior: high current at low \( \lambda \), dropping to zero at \( \lambda_0 \), and staying zero for \( \lambda > \lambda_0 \).
- Graph 2 shows current starting from zero and increasing as wavelength increases, eventually leveling off. This contradicts the requirement that current is zero for \( \lambda > \lambda_0 \) and increases for decreasing \( \lambda \).
- Graph 3 shows current decreasing rapidly from a maximum to zero as wavelength increases, and staying zero after a certain point. Similar to Graph 1, this shows the correct qualitative behavior of current dropping to zero at the threshold wavelength.
- Graph 4 shows current being zero up to a certain wavelength \( \lambda_0 \), and then increasing as wavelength decreases (moving left on the graph). This also matches the expected behavior: zero current for \( \lambda \ge \lambda_0 \) and increasing current for \( \lambda < \lambda_0 \) as \( \lambda \) decreases.
Comparing Graph 1 and Graph 4, both show current is zero for \(\lambda \ge \lambda_0\) and non-zero for \(\lambda < \lambda_0\). Graph 1 shows the current decreasing as \(\lambda\) increases towards \(\lambda_0\). Graph 4 shows the current increasing as \(\lambda\) decreases from \(\lambda_0\). Both represent the same relationship from different perspectives on the x-axis (increasing vs decreasing \(\lambda\) relative to reading the graph from left to right). However, graphs typically show the dependent variable (current \(I\)) on the y-axis and the independent variable (wavelength \( \lambda \)) on the x-axis, with the x-axis values increasing from left to right. Graph 4 shows \(\lambda\) increasing from left to right, current is zero, then drops to zero at \(\lambda_0\), and increases as \(\lambda\) decreases (moving left). Graph 1 also shows \(\lambda\) increasing from left to right, current is high at low \(\lambda\), decreases as \(\lambda\) increases, hits zero at \(\lambda_0\), and stays zero. Both are plausible representations of the expected physics. Graph 4 seems to explicitly show the threshold \(\lambda_0\) where the current becomes non-zero as \(\lambda\) decreases from values greater than \(\lambda_0\).
Let's stick to the interpretation that the x-axis represents increasing wavelength from left to right in all graphs. In this case, Graph 1 shows current dropping to zero at \( \lambda_0 \) and staying zero for larger \( \lambda \). Graph 4 shows current being zero for \( \lambda \ge \lambda_0 \) and becoming non-zero and increasing as \( \lambda \) decreases from \( \lambda_0 \). Both are qualitatively consistent with the physics. Graph 4 is often depicted in textbooks to clearly show the threshold wavelength where the current starts.
Conclusion
The plate current \( I \) of a photocell is zero when the wavelength of the incident light is greater than or equal to the threshold wavelength \( \lambda_0 \). For wavelengths shorter than \( \lambda_0 \), photoemission occurs, and the current increases as the wavelength decreases (photon energy increases), assuming fixed light intensity and sufficient anode voltage. The graph that best represents this relationship, showing zero current above the threshold wavelength and increasing current as wavelength decreases below the threshold, is the one where the current is zero for \( \lambda \ge \lambda_0 \) and increases as \( \lambda \) decreases for \( \lambda < \lambda_0 \).
Revision Table: Key Photocell Concepts
| Concept | Description | Condition/Formula |
|---|---|---|
| Photoelectric Effect | Emission of electrons from a material when light hits its surface. | Requires photon energy >= work function |
| Work Function (\( \phi_0 \)) | Minimum energy required to remove an electron from the material surface. | Characteristic of the cathode material |
| Threshold Wavelength (\( \lambda_0 \)) | Maximum wavelength of light that can cause photoemission. | \( \lambda_0 = \frac{hc}{\phi_0} \) |
| Plate Current (I) | Current in the photocell circuit due to collected photoelectrons. | Proportional to the number of emitted electrons collected by the anode. |
Additional Information: Factors Affecting Photocurrent
Besides the wavelength of light, several other factors affect the plate current in a photocell:
- Intensity of Light: For a given wavelength below the threshold, increasing the intensity of light means more photons are incident on the cathode per second. This leads to the emission of more photoelectrons per second, and thus the plate current increases proportionally with the intensity (assuming saturation voltage is applied).
- Anode Voltage: If the anode is positive relative to the cathode, it attracts photoelectrons. Increasing the positive anode voltage initially increases the current by collecting more of the emitted electrons, including those with lower kinetic energy. Eventually, the current saturates at the saturation current when all emitted photoelectrons are collected. If the anode voltage is made negative (stopping potential), it opposes the motion of electrons, and the current decreases, becoming zero at the stopping potential.
- Material of the Cathode: The material of the cathode determines the work function \( \phi_0 \), which in turn determines the threshold wavelength \( \lambda_0 \). Different materials will have different responses to light of the same wavelength and intensity.
Important Questions from Dual Nature of Radiation and Matter
The work function for an Aluminium surface is 4.2 eV. Find the threshold wavelength for the photoelectric emission.
A potentiometer wire of length L and a resistance r are connected in series with a battery of emf E0 and a resistance r1. An unknown emf E is balanced at a length l of the potentiometer wire. The emf E will be:
The time taken by light to travel normally through a glass plate of thickness 1 mm would be:
(Take refractive index of glass = 1.5)
Energy of a photon corresponding to a wavelength of 600 nm is 2.08 eV. The energy of a photon of wavelength 400 nm will be:
A particle moves three times as fast as an electron. The ratio of the de Broglie wavelength of the particle to that of the electron is 1.813 × 10⁻⁴. The mass of the particle is:


